
Figure 2.
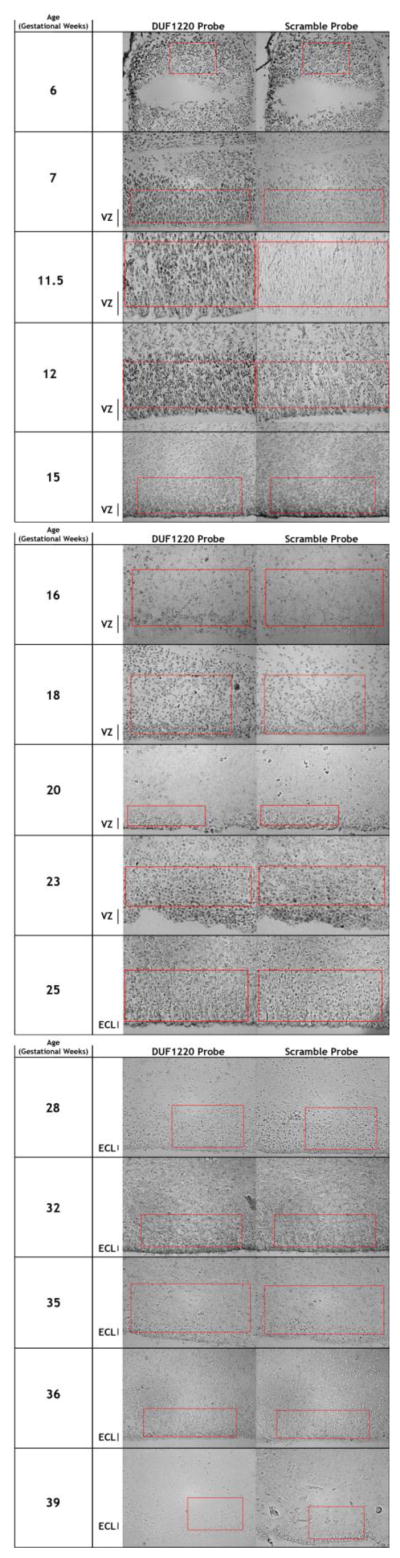
Time course of human fetal brain tissue samples showing differences in DUF1220 (left column) and Scramble (right column) probe signals. Telencephalic samples are presented at 40X, and regions used for probe quantification are indicated by red boxes. Estimates for the ventricular and subventricular zones by cell density are indicated to the left. Developmental time is in gestational weeks (G.W.). VZ: ventricular zone. ECL: ependymal cell layer.