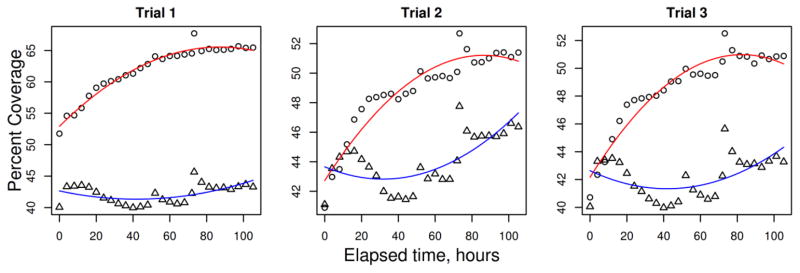
Figure 4.
Total cell coverage plotted over time. Cultures of H9-derived human embryonic stem cells were transfected with NBPF15 (6 DUF1220 domains; circles) or an empty mock construct (triangles) at time = 0 and imaged every three hours. Cellular coverage was measured for each time point and plotted over time, and a curve was fitted to each experiment (NBPF15 in red and mock in blue).

