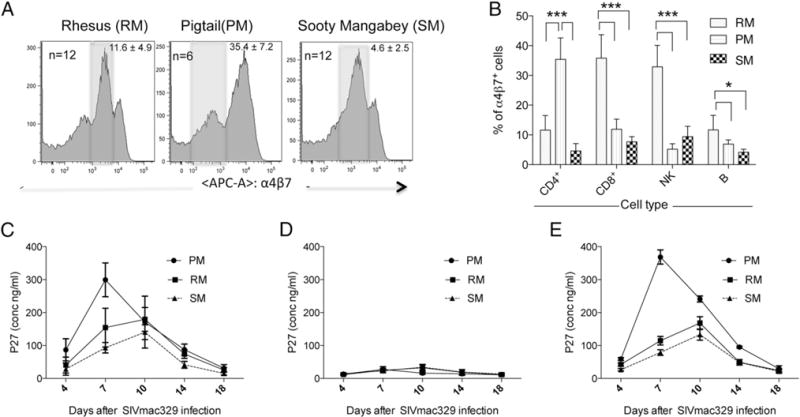
FIGURE 1.

(A) Representative profiles of the surface expression of α4β7 on the gated population of CD3+ CD4+ T cells in the PBMCs from RM (n = 12), PM (n = 6), and SM (n = 12). The numbers within each profile reflect the frequency (%) of α4β7hi-expressing cells (mean ± SD); the shaded area represents the medium α4β7-expressing cells, and the area to the right reflects cells that are classified as α4β7hi. (B) Quantification of the frequency (%) of α4β7+ CD4+, CD8+, NK, and B cells (mean ± SD) from the same number of RM, PM, and SM as shown in (A). (C) Highly enriched populations of CD4+ T cells from RM, PM, and SM (n = 12 RM and SM; n = 6 PM) stimulated for 2 d in vitro with anti-CD3/28 + IL-2 were cultured in triplicate in vitro with SIVmac239, and supernatant fluid collected on days 4, 7, 10, 14, and 18 was analyzed for the levels of p27. The mean ± SD of the levels of p27 (ng/ml) for each of the three species is shown. (D) PBMCs from RM, PM, and SM (n = 5 RM, n = 3 PM, and n = 5 SM) were either depleted of α4β7-expressing CD4+ T cells or (E) treated with normal rhesus IgG and stimulated with Con A + IL-2 for 2 d and then infected with SIVmac239, and supernatant fluids were collected on days 4, 7, 10, 14, and 18 d and analyzed for the levels of p27 using commercial kits. *p < 0.05, ***p < 0.0001.
