
FIGURE 2.
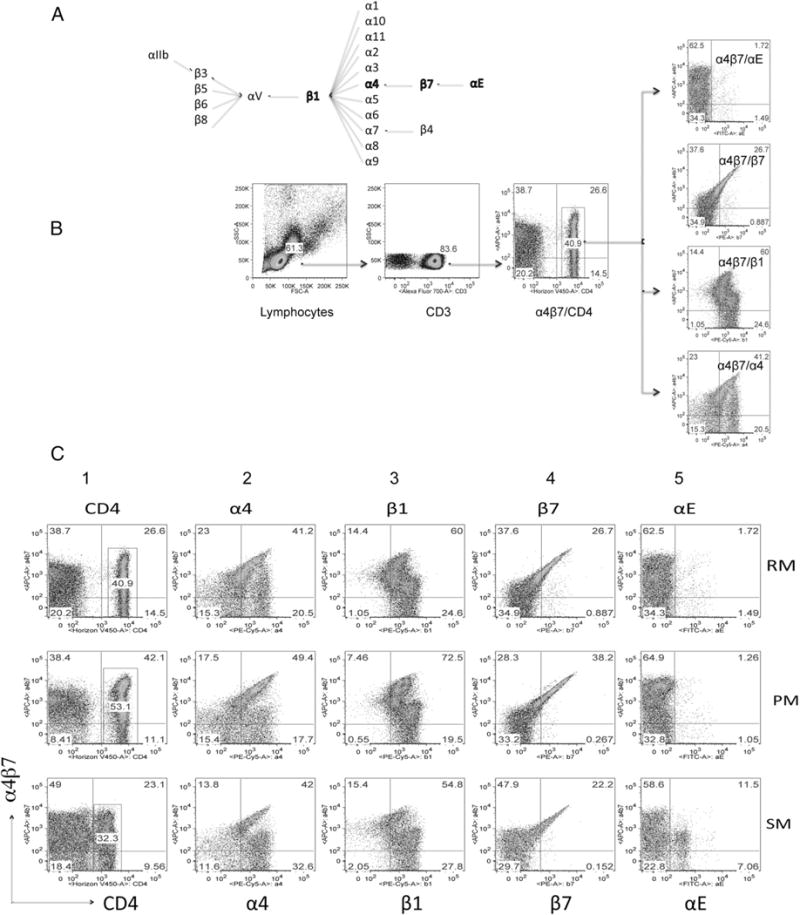
(A) Pairing patterns of various α- and β-chains of integrins and (B) a representative profile of the gating strategy that was used to define the percentages of CD4+ T cells expressing α4β7, α4, β1, β7, and αE in samples of PBMCs from the three species. (C) Representative profiles of the flow-cytometric analysis of the pairing of α4, β1, β7, αE with α4β7 integrins (columns 1–5, respectively) from RM (top row), PM (middle row), and SM (bottom row). The analysis was performed on the gated population of CD3+ CD4+ T cells (as displayed in C). This gated population was then analyzed for the expression of α4β7 by CD4+ T cells (column 1), and the gated population of CD4+ α4β7+ cells was then analyzed for their coexpression of α4 (column 2), β1 (column 3), β7 (column 4), and αE (column 5).