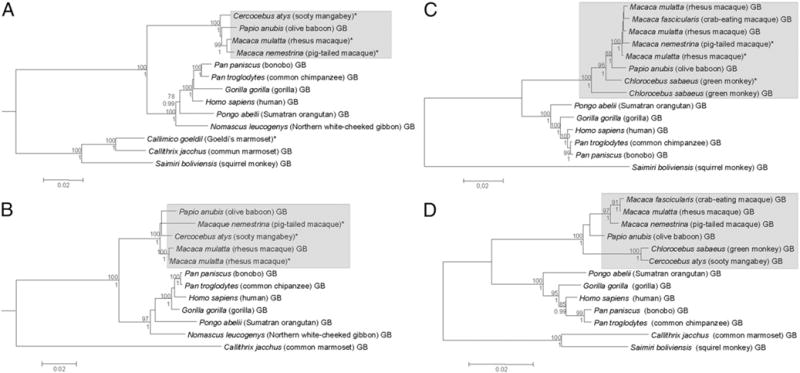
FIGURE 3.

Phylogenetic inferences of Integrin α4 (α4; A), Integrin β7 (β7; B), integrin αE (αE; C), and CCR5 (D) promoters of RM, SM, and PM compared with those of other NHPs. For all four trees shown, both ML and BI analyses were carried out, and they both rendered the same tree topologies, which could be shown in single consensual trees. Sequences with asterisks represent those generated in this study, whereas those with the “GB” suffix denote sequences retrieved from the GenBank database. Numbers above and below each node of the trees are the ML bootstrap and BI posterior probability values, respectively, and only values >75% and 0.99, respectively, are shown. Scale bars at the bottom of the trees represent nucleotide substitutions per site.
