
FIGURE 6.
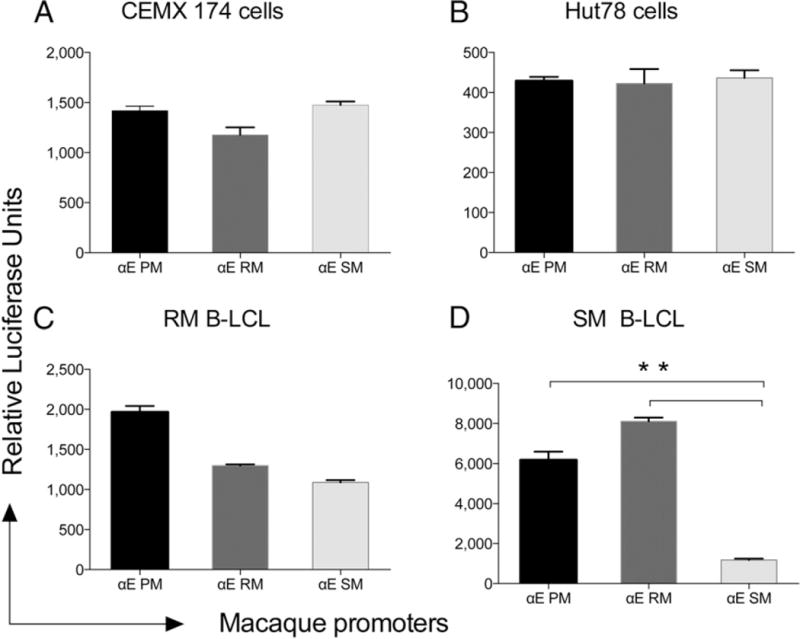
Reporter gene analysis of αE promoter–driven gene expression analysis using (A) CEMX174 cell line, (B) HUT78 cell line, (C) rhesus B-LCL, and (D) SM B-LCL. All experimental conditions were similar to those described in the legend for Fig. 5. **p < 0.001.