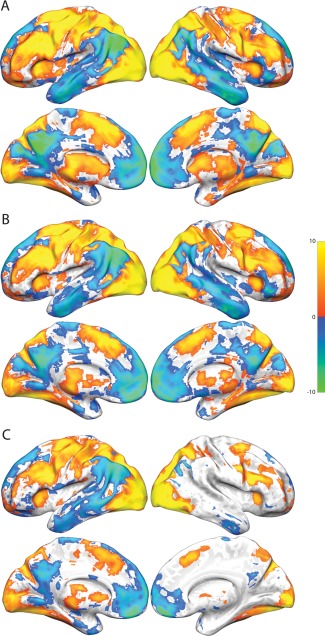
Figure 8.

Activation and deactivation relative to the control task in each of the three (early, middle, and late) task phases in Study 2. All activation and deactivations thresholded at P < 0.05, FDR corrected. (A) Early phase activation and deactivation. (B) Middle phase activation and deactivation. (C) Late phase activation and deactivation.
