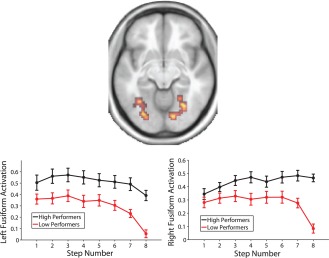
Figure 9.

Regions showing a significant (P < 0.05, whole brain FDR corrected) correlation with performance during the late task phase (average of Steps 7 and 8) in an axial slice at MNI coordinate z = −10. Line plots show activation in the left and right hemisphere regions broken down by a median split on performance during the late task phase, for illustrative purposes (statistical analysis was not based on a median split). Error bars are ±1 standard error.
