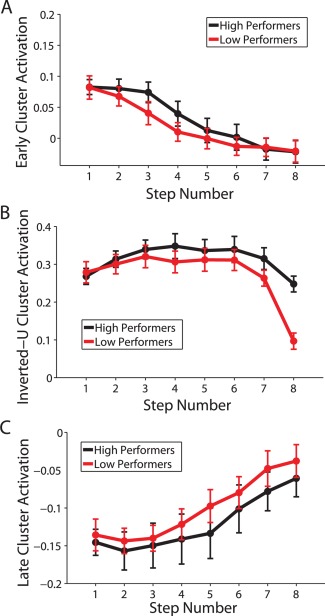
Figure 12.

Overall activation in the three clusters identified by group‐level k‐means clustering, based on a median split of accuracy in the last task phase (average accuracy across Steps 7 and 8). The y‐axes in all plots reflect fMRI % signal change values. Error bars reflect ±1 standard error. (A) Activation throughout regions significantly associated with the early activating pattern. (B) Activation throughout regions significantly associated with the inverted‐U pattern. (C) Activation throughout regions significantly associated with the late activating pattern.
