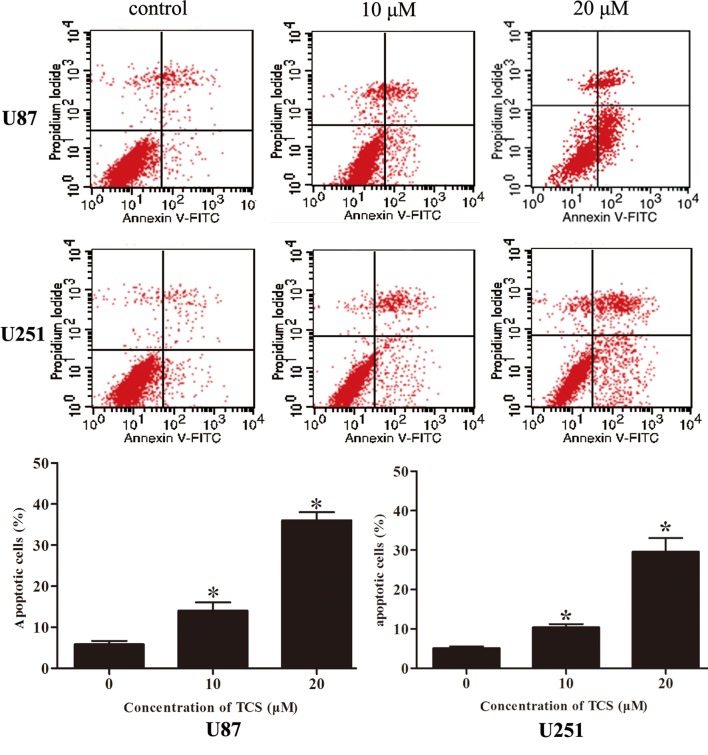
Figure 2.
Analysis of apoptosis via Annexin V/PI staining. U87 cells were cultured in DMEM and were treated with TCS (10, 20 µM) or vehicle (PBS) for 24 h. The cells were analyzed via flow cytometry after staining with Annexin V/PI. The percentage of apoptotic cells (right lower quadrant, early apoptotic cells; right upper quadrant, late apoptotic cells) was analyzed using CellQuest Pro software. Lower graphs show the percentage of apoptotic or dead cells. *P<0.05 compared to the respective PBS-treated (control) cells. The data are presented as the mean ± SD of three independent experiments.

