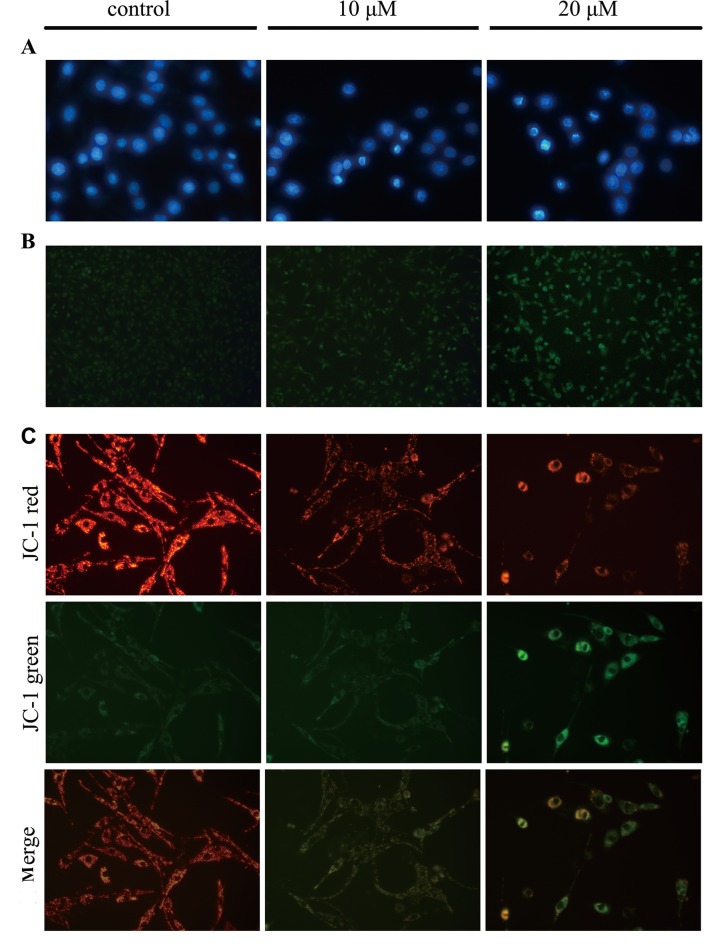
Figure 3.
TCS induces apoptosis in glioma cells. (A) U87 cells were cultured in DMEM containing TCS (10, 20 µM) or PBS for 24 h, and changes in nuclear morphology were observed via DAPI staining and fluorescence microscopy. The experiment was repeated three times, and the images are representative. (B) Apoptotic cells were detected via TUNEL staining. U87 cells were treated as described above prior to TUNEL staining. The number of TUNEL-positive cells was significantly increased due to TCS treatment. Representative images of TUNEL staining are shown. (C) The mitochondrial membrane potential of glioma cells was decreased due to TCS treatment. U87 cells were treated with TCS (10, 20 µM) or PBS for 24 h, and the decrease in the mitochondrial membrane potential was observed based on JC-1 staining via fluorescence microscopy. The images are representative of three independent experiments.

