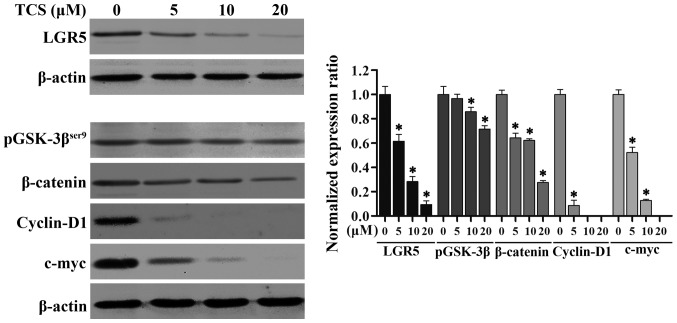
Figure 5.
Western blot analysis of LGR5 and Wnt/β-catenin signaling pathway proteins. U87 cells were treated with different concentrations of TCS (5, 10, or 20 µM) or vehicle (PBS) for 24 h. Protein samples were obtained from the four groups and were analyzed via western blot analysis. The results showed that the protein levels of LGR5 and key members of the Wnt/β-catenin signaling pathway (pGSK-3βSer9, β-catenin, c-myc and cyclin D1) were downregulated in response to increasing TCS concentrations. Right panel, quantitative analysis of protein expression from three independent experiments. *P<0.05 compared with the control group.

