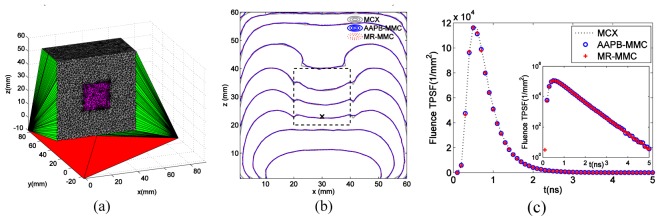
Fig. 4.
Simulation of a heterogeneous numerical phantom with a cubic inclusion, (a) cross-sectional view of the retessellated mesh, (b) CW fluence contour plots along plane y = 29.5 mm with 5 dB spacing and (c) TPSFs (log-scale shown in inset) measured at the black cross in (b) for MR-MMC, AAPB-MMC and MCX. The inclusion is shown in dashed lines.

