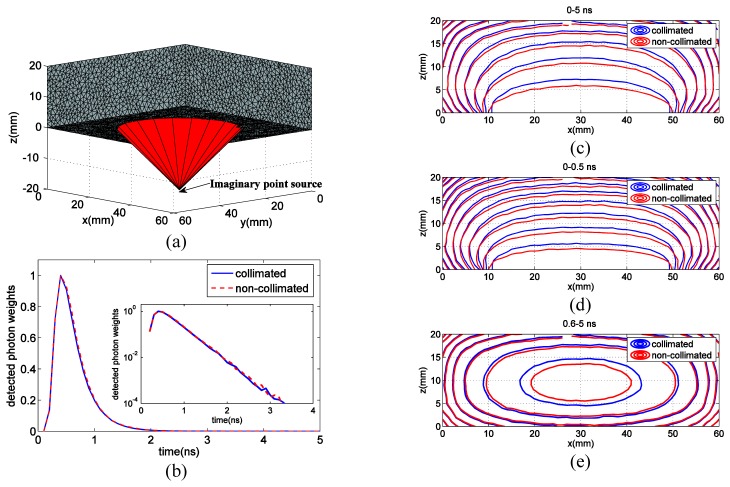
Fig. 6.
Comparison between collimated and non-collimated beam fluence profiles. (a) Retessellated mesh model with imaginary point source of a non-collimated beam, (b) TPSF curves at the detector with peak normalized to 1, and fluence contours of (c) CW, (d) early gates and (e) late gates. An animated time-dependent fluence profiles for the first 2.5 ns can be viewed in Visualization 1 (28.4MB, AVI) .

