
Fig. 2.
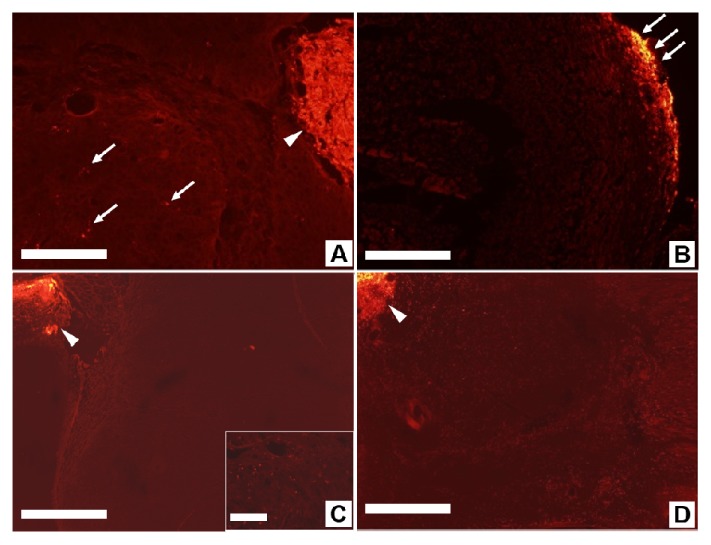
Migration of fluorescence-labeled macrophages in xenograft tumors. (A) Intratumoral injection of macrophage. Xenograft tumor with labeled macrophages injected inside shows the migration of a few macrophages (arrow) from the injection site (arrowhead). Scale bar is 100 μm.(B) 12 hours after peritumoral injection of macrophage, the Xenograft tumor capsule image shows accumulation of labelled macrophages (arrows). Scale bar is 200 μm. (C) 24 hours after peritumoral injection the tumor image shows that some macrophages have migrated from the injection site (arrowhead) into the tumor, as visible in the inset. Scale bars are 500 μm and 100 μm. (D) 48 hours after peritumoral injection, the macrophages have extensively migrated (bright red dots) from the injection site (arrowhead) into the tumor. Scale bar is 500 μm.