
Fig. 3.
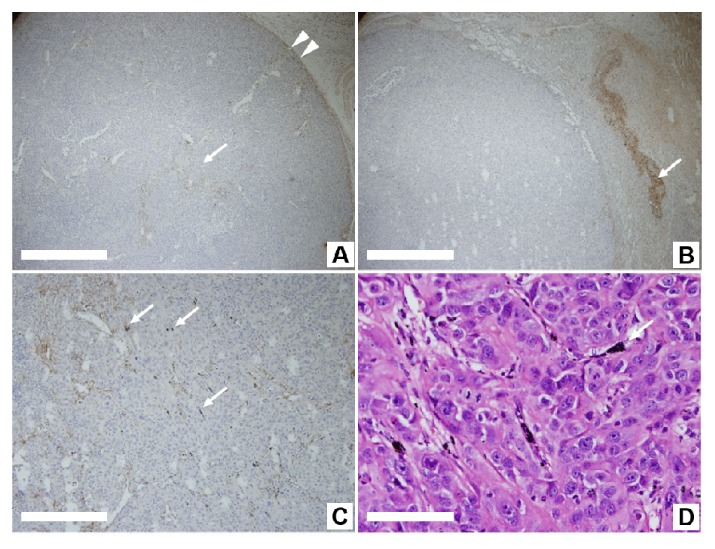
Immunohistochemically stained images of macrophages in the xenograft tumor. (A) In the xenograft tumor not subjected to the injection of NS-loaded macrophages and laser irradiation, the stained innate macrophages are distributed along the tumor capsule (arrowheads) and around the vascular space within the tumor (arrow). The scale bar is 500 μm. (B) In the xenograft tumor injected with NS-loaded macrophages and exposed to PTT, the majority of injected macrophages stayed near the injection site, where the aggregated NSs are shown as black particles (arrow). The scale bar is 500 μm. (C) NSs aggregated into coarse particle of approximately 10 μm within the tumor mass after exposure to PTT (arrow). The scale bar is 200 μm. (D) Aggregated NSs are observed between cancer cells after exposure to PTT (arrow) and with H&E stain. The scale bar is 50 μm.