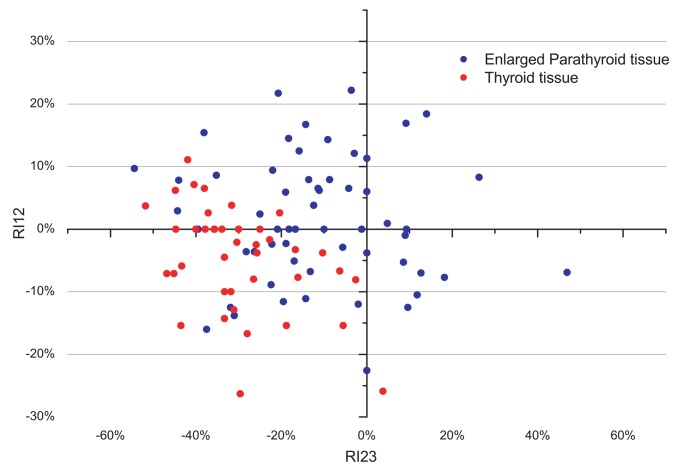
FIGURE 2.
Retention index (RI) between the second and the third phase (RI23) versus RI between the first and the second phase (RI12) for all LREPT (A), and for thyroid tissue (B). Positive (negative) values of both RI12 and RI23 represent SUVmean increase (decrease) through different phases; whereas positive (negative) RI12 and negative (positive) RI23 represent an increase (decrease) of SUVmean after the first phase, followed by a decrease (increase) after the second phase.

