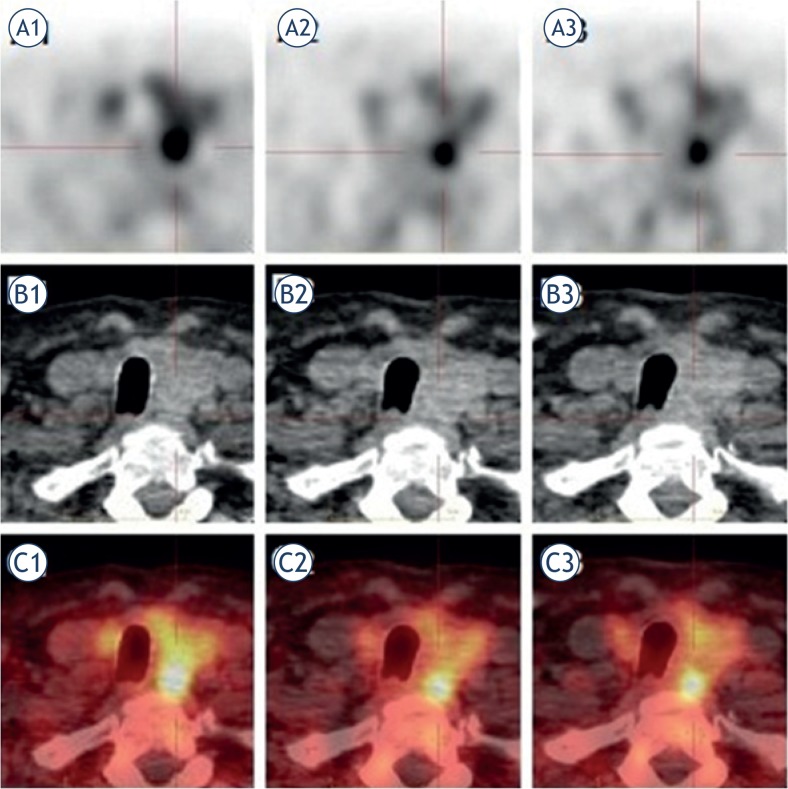
FIGURE 4.
A secluded lower left LREPT. FCH PET/CT was performed in triple-phase after administration of 100 MBq of FCH. The LREPT is well delineated according to the thyroid tissue on PET axial image in the first (A1), the second (A2) and the third phase (A3). SUVmean in the LREPT and the thyroid tissue was in the first phase 6.3 and 3.6, in the second phase 7.1 and 3, and in the third phase 6.6 and 2.9. The CT axial image of the LREPT and the thyroid tissue in all three phases (B1, B2, B3), and the FCH PET/CT axial fusion image in all three phases (C1, C2, C3).

