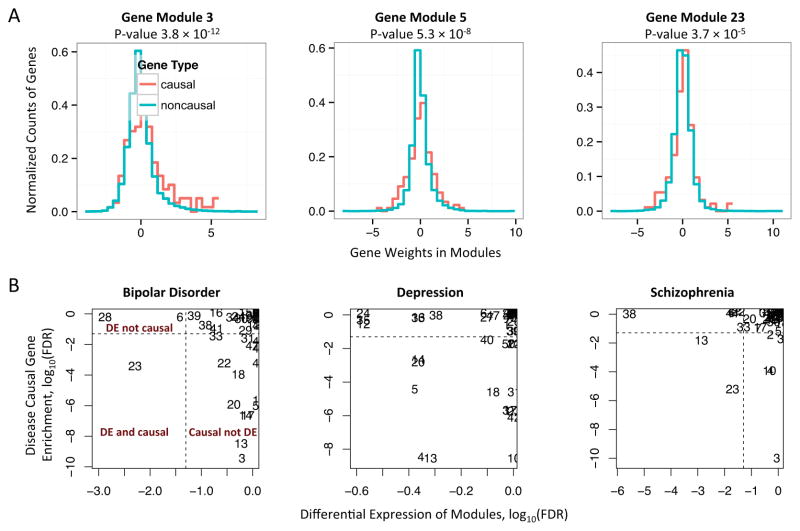
Figure 3.
Disease causing and differential expression (DE) are orthogonal at the pathway level. A. Gene modules learnt by ICA and GWAS implicated putative disease causing genes are associated by enrichment analysis. The plots overlay the distributions of the weights of the putative causal genes of bipolar disorder (red) against the distribution of the weights of the other genes (cyan) in 3 modules. The p-values are obtained by biLM comparing the spreads of the genes’ weights in two distributions. B. Scatter plot of the causal gene modules versus the DE gene modules for 3 psychiatric disorders. Many causal gene modules are not significantly differentially expressed, while many DE gene modules are not enriched with putative causal genes. The numbers in the plots are the IDs of gene modules. The x and y axes are FDR (the multi-testing corrected p-values) at log scale. Dashed lines correspond to FDR level 0.05.

