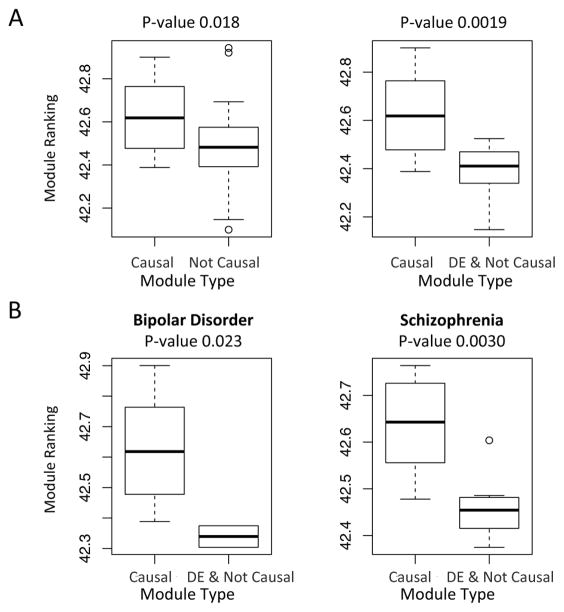
Figure 5.
Gene regulation network based ranking differentiates the causal versus non-causal gene modules. The causal modules tend to be ranked lower (i.e. with higher rank values). A. Boxplots comparing the ranking of putative causal modules versus other modules (left) or putative causal modules versus the DE & Not Causal modules (right). A putative causal module is defined as a module that shows significant enrichment (FDR < 0.05) of GWAS implicated putative causal genes. A DE & Not Causal module is defined as a differentially expressed module (FDR < 0.05) that is not causal. For each module, p-values for 3 psychiatric disorders are combined into one p-value by Fisher’s methods, for either differential expression or the enrichment of putative causal genes. The p-values shown in the figures are obtained by two-tailed two-sample t-tests. B. The comparison of putative causal modules versus the DE & Not Causal modules for individual psychiatric disorders. Note there are no significant DE modules for major depression.

