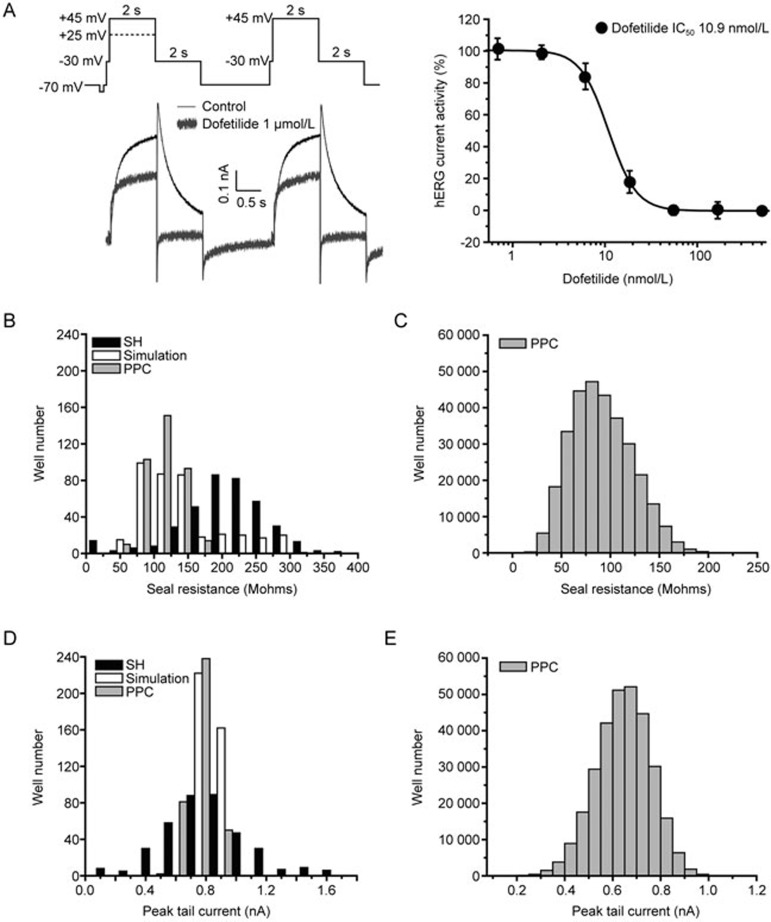
Figure 1.
Seal resistance and current expression of hERG-CHO stable cell line measured using the IonWorks Quattro™ system. (A) Recording protocols and the typical hERG current traces in the absence and presence of 1 μmol/L Dofetilide. In the displayed protocol, the solid line represented the protocol used for majority of compounds while the dashed line presented a voltage pulse used in a small fraction of compounds of the screening. Dose-response curve for Dofetilide is displayed in the right panel. (B) Histograms of seal resistance recorded across 384 wells of single-hole (HT) (black color filled bars) and population patch clamp (PPC) (grey color filled bars) using hERG-CHO cells at a density 1.8×10⁶ cells/mL. The bootstrap analysis was applied to the data from single-hole mode to simulate the distribution of seal resistance in the PPC mode (as shown in the unfilled bars). (C) The distribution of the seal resistance (PPC mode) for the screened library with the mean±SD values at 89.66±36.26 Mohms. (D) Histograms of peak tail current amplitude obtained from single-hole (black color filled bars) and PPC modes (grey color filled bars). Peak currents at the first test pulse were measured in each well. Similar to the seal resistance, the bootstrap analysis was performed to estimate the distribution of hERG tail current on PPC mode using experimental results from the single-hole mode (as shown in unfilled bars). (E) The distribution of the peak currents (PPC mode) for the screened library with the mean±SD values at 0.62±0.17 nA.

