Figure 3.
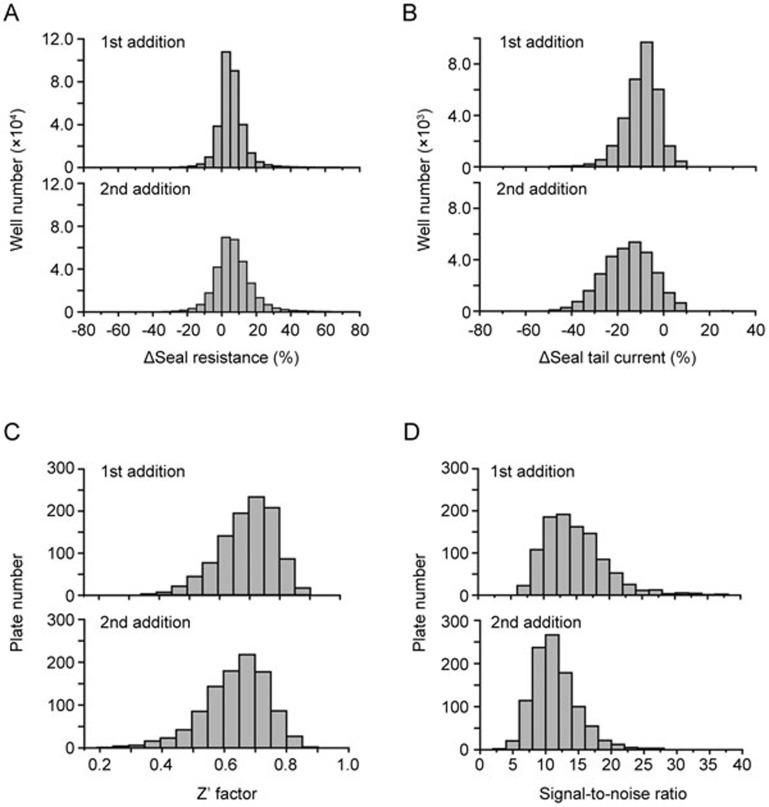
Data stability of the dual additions for seal resistance and hERG peak tail currents. The histograms of seal resistance and hERG currents are shown in (A) and (B). Seal resistance change (%) was determined by the formula 100 %*[(Rpost-1-Rpre)/Rpre] (first addition) and 100 %*[(Rpost-2-Rpre)/Rpre] (second addition) from the compound treated wells, which are represented as mean±SD values of 6.63±9.13 (%) and 5.55±12.56 (%), respectively. And the tail current change (%) was calculated by the formula 100%*[(Ipost-1-Ipre)/Ipre] (first addition) and 100%*[(Ipost-2-Ipre)/Ipre] (second addition) from the vehicle treated wells, which are represented as mean±SD values of −8.87%±7.54% and −13.99%±11.84%. The histogram distribution of Z′ factor and signal noise ratio for the first addition are shown in the upper panels of (C) and (D). The data exhibited mean±SD values of 0.70±0.09 (Z′ factor) and 14.72±4.60 (signal-to-noise ratio), respectively. For the second addition, the mean±SD values are 0.64±0.10 (Z′ factor) (lower panel of C) and 11.47±3.45 (signal-to-noise ratio) (lower panel of D), respectively.

