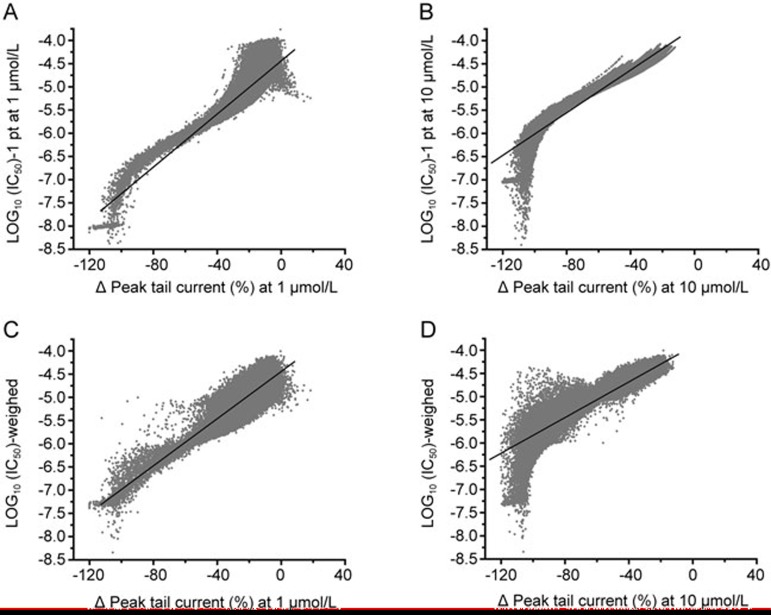
Figure 5.
Linear regression analysis to assess the mathematical prediction for the IC50. The R value is 0.90 and 0.95 respectively for 1 μmol/L (A) and 10 μmol/L (B) for the one-point method. Further the relationship between the percent inhibition and Log10 (IC50) from the weighed method was generated. R value is 0.89 (at 1 μmol/L) (C) and 0.91 (at 10 μmol/L) (D).

