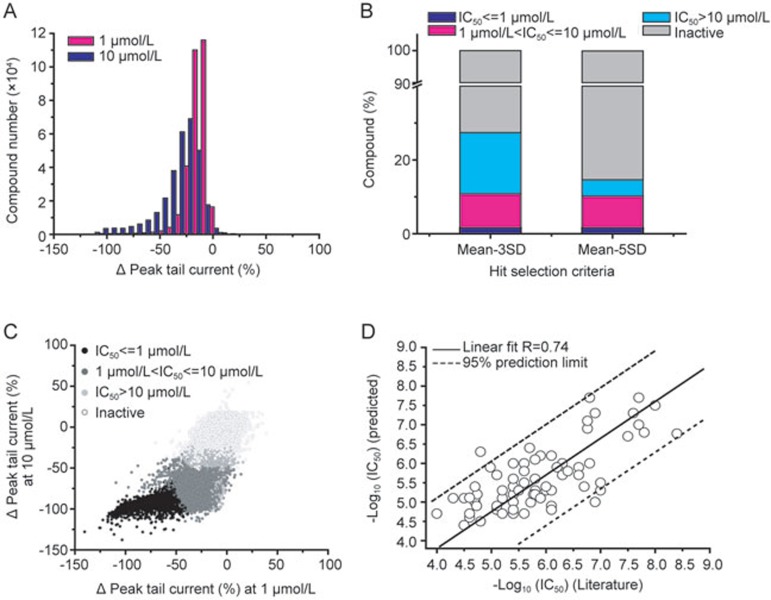
Figure 6.
Summary of MLSMR compound library on hERG channels. (A) Distribution of compound effects on peak tail current. Black bars are for tail current percentage change at 1 μmol/L and red bars are for 10 μmol/L. (B) Effects of inhibitor select criteria on hit rates. hERG inhibitors were ranked based on their IC50s calculated using weighed 1-point method based on the two hit selection criteria (Mean of Control-3SD or Mean of Control-5SD) at 10 μmol/L. Black box: IC50<=1 μmol/L; grey box: 1 μmol/L<IC50<=10 μmol/L; light grey box: IC50>10 μmol/L; white box: inactive. (C) Correlation of compound effects at 1 μmol/L and 10 μmol/L. The scatter plot of tail current change for each tested compound at 1 μmol/L (horizontal axis) and 10 μmol/L (Vertical axis), is color-coded by the potency classes. Black filled circles indicate inhibitors with IC50<=1 μmol/L; grey filled circles indicate inhibitors with IC50 between 1 μmol/L and 10 μmol/L; light grey filled circles indicate inhibitors with IC50>10 μmol/L with the cutoff at mean-3SD of vehicle control at 10 μmol/L; open circles indicate hERG activators and inactive compounds. (D) Correlation between the predicted and literature reported IC50 for 74 known hERG inhibitors.

