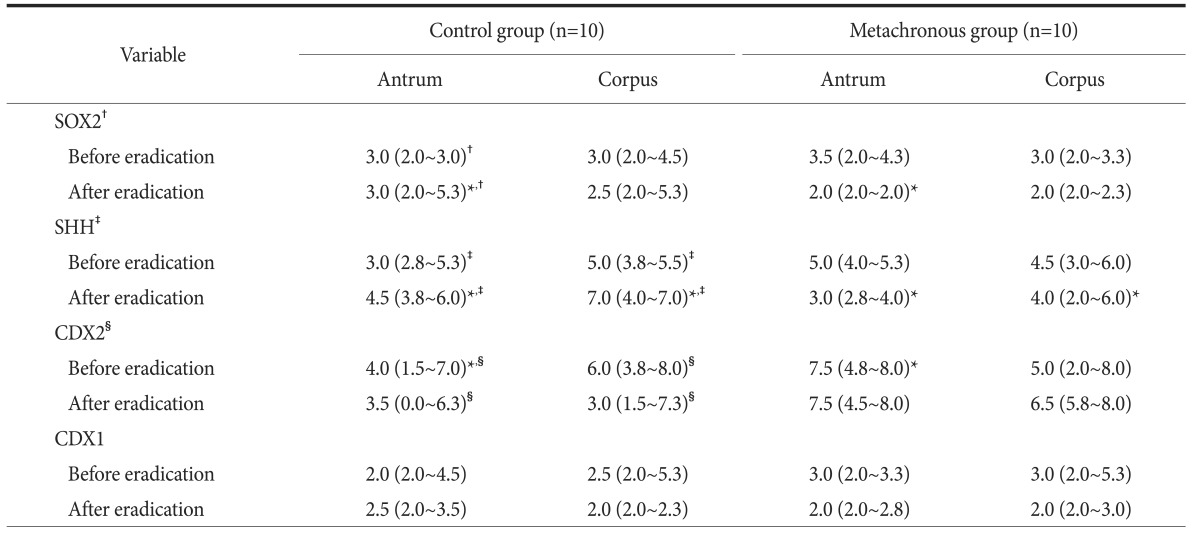
Table 4. Expression of SOX2, SHH, CDX2, and CDX1 proteins in background gastric mucosa.
Values are presented as median (interquartile range). The Wilcoxon signed-rank test and Mann-Whitney U-test were used for evaluating the immunohistochemical expression levels. *P<0.05, compared between the control and metachronous groups. The expression levels were determined by scoring both the positive rate and the intensity of Sonic hedgehog (SHH), CDX1, CDX2, and SOX2 staining. The positive expression rate was determined by counting the number of immunopositive cells in three areas randomly chosen in the tissue in a total of 300 cells and given scores (0=0%, 1=1%~25%, 2=26%~35%, 3=36%~45%, 4=46%~65%, 5=66%~100%). The staining intensity was scored as follows: 0, no detectable cytoplasmic staining; 1, mild cytoplasmic staining; 2, moderate cytoplasmic staining; and 3, severe cytoplasmic staining. Two scores were then summed to obtain a final score of 0 and 8. †The expression of SOX2 staining in the antrum increases in the control group after Helicobacter pylori eradication. ‡The expression of SHH staining in the antrum and corpus increases in the control group after H. pylori eradication. §The expression of CDX2 staining in the antrum and corpus decreases in the control group after H. pylori eradication.

