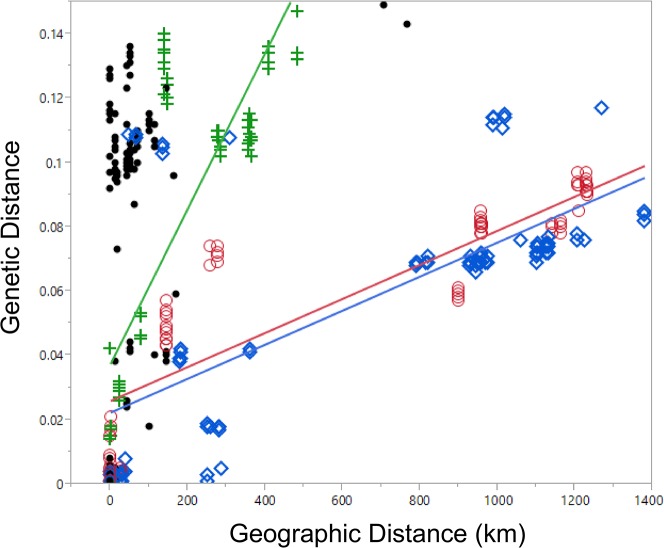
Fig 2. Genetic Distance by Geographic Distance.
Linear regression of the relationship of genetic distance to geographic distance by species. The slopes of the lines of the ICF species M. rogeri (blue diamonds) and M. barrybressleri (red circles) are not significantly different from each other (F1 = 0.000, p = 0.995), but are significantly different from the DCF species M. oberthueri (green cross) (F1 = 111.036, p < .0001). The DCF species M. voeltzkowi and M. mirror are represented by black dots and were not included in the regression analysis.

