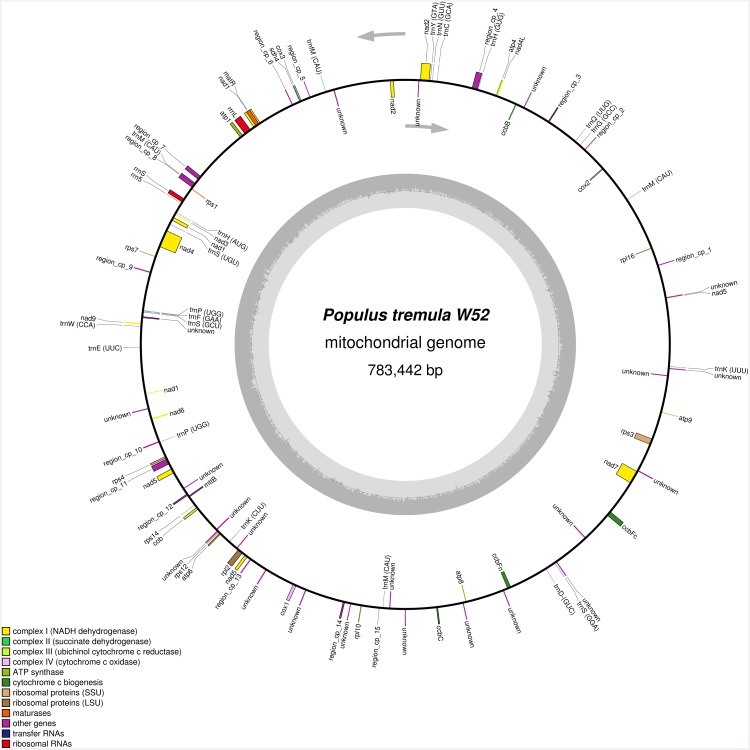
Fig 3. Gene map of the complete P. tremula W52 mitochondrial genome (GenBank accession number KT337313).
In addition to protein-coding and structural RNA genes, regions of at least 90% similarity to the chloroplast genome of W52 are depicted (“region_cp_1 to region_cp_15”; coloured as “other genes”). The grey arrows indicate the direction of transcription of the two DNA strands. A GC content graph is depicted within the inner circle. The circle inside the GC content graph marks the 50% threshold. The map was created using OrganellarGenomeDraw [51].

