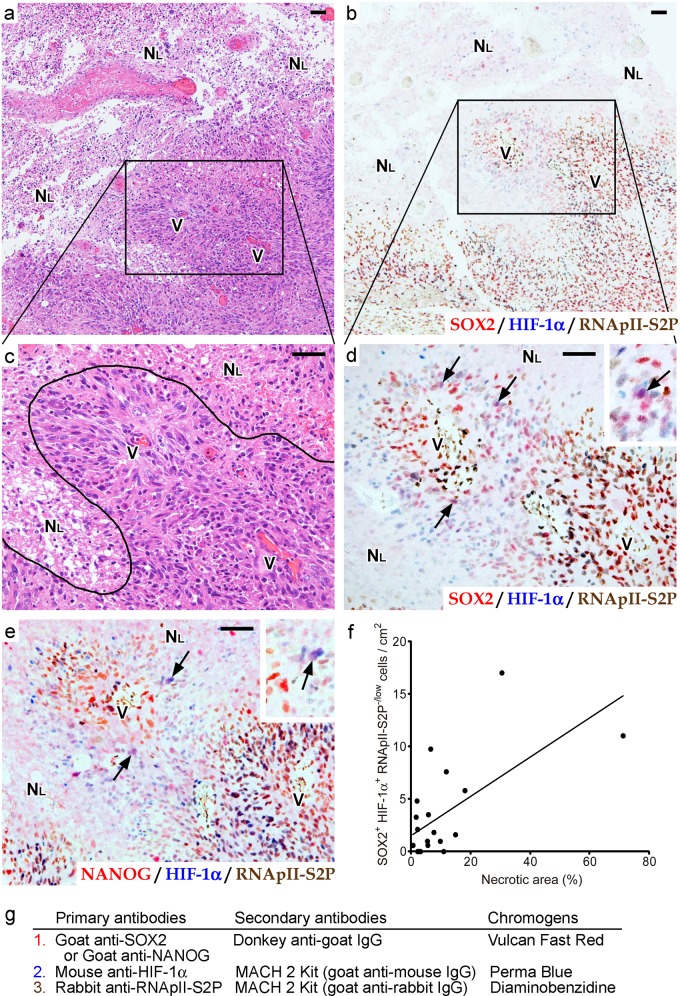
Fig 2. Detection of SOX2+ (or NANOG+) HIF-1α+ RNApII-S2P-/low tumor cells by multi-color chromogenic immunostaining in glioblastoma tissues reveals that these cells are associated with large ischemic necroses.
a-e: Serial sections of glioblastoma tissue around a large ischemic necrosis. H-E staining (a, c), triple staining for SOX2/HIF-1α/RNApII-S2P (b, d) or NANOG/HIF-1α/RNApII-S2P (e) are shown (SOX2 or NANOG, red; HIF-1α, blue; RNApII-S2P, brown). Boxes in a and b indicate the magnified areas in c and d, respectively. A curved line in c represents the border between a large ischemic necrosis and viable tumor tissue. Arrows in d and e mark SOX2+ HIF-1α+ RNApII-S2P-/low cells and NANOG+ HIF-1α+ RNApII-S2P-/low cells, respectively. Insets in d and e show higher magnifications of these cells (arrows). NL, large ischemic necrosis; V, blood vessels. Scale bars, 50 μm. f: Correlation between the relative area of necrosis and the frequency of SOX2+ HIF-1α+ RNApII-S2P-/low cells in 21 glioblastoma cases. Line indicates the regression line (y = 0.188x + 1.46, Pearson’s correlation coefficient r = 0.64). g: Summary of the staining methods used in b and d–f. Sections were incubated with goat anti-SOX2 or anti-NANOG antibody and then with alkaline phosphatase (AP)-conjugated donkey anti-goat IgG secondary antibody, and color was developed with Vulcan Fast Red. After denaturing, mouse anti-HIF-1α antibody and rabbit anti-RNApII-S2P antibody were applied, and then the sections were reacted with MACH 2 Double Stain 1 (a secondary antibody cocktail of AP-conjugated anti-mouse IgG and horseradish peroxidase-conjugated anti-rabbit IgG antibodies). Color was developed with Perma Blue/AP for HIF-1α and diaminobenzidine for RNApII-S2P.

