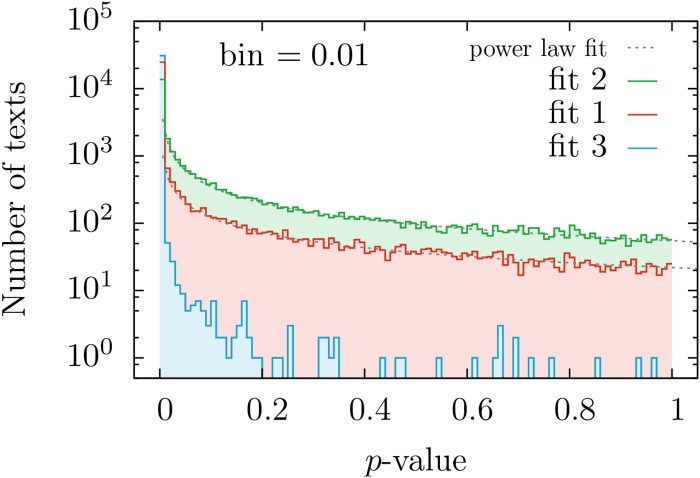
Fig 2. Histograms of p-values obtained when the Zipf-like distributions f1, f2, and f3 are fitted to the texts of the English Project Gutenberg.
The histograms just count the number of texts in each bin of width 0.01. Note the poor performance of distribution 3 and the best performance of 2. Power-law approximations to the histograms for f1 and f2, with respective exponents 0.74 and 0.78, are shown as a guide to the eye.

