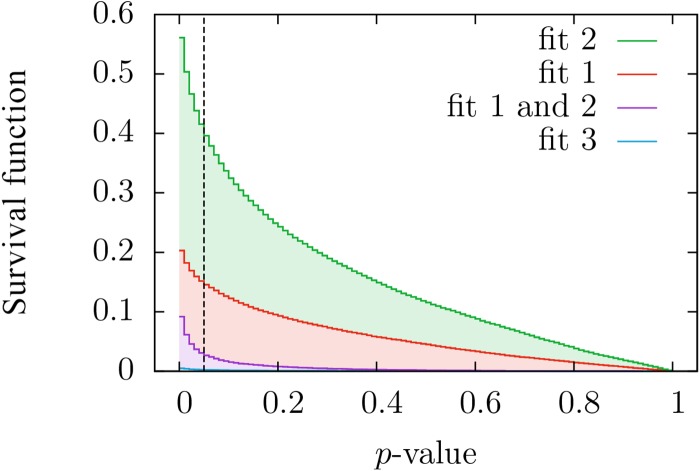
Fig 3. Complementary cumulative distributions (i.e., survival functions) of p-values obtained when our three distributions are fitted to the texts of the English Project Gutenberg.
This corresponds, except for normalization, to the integral of the previous figure, but we have included a fourth curve for the fraction of texts whose p-values for fits 1 and 2 are both higher than the value marked in the abscissa. Note that the values of p can play the role of the significance level. The value for p = 0 is not shown, in order to have higher resolution.

