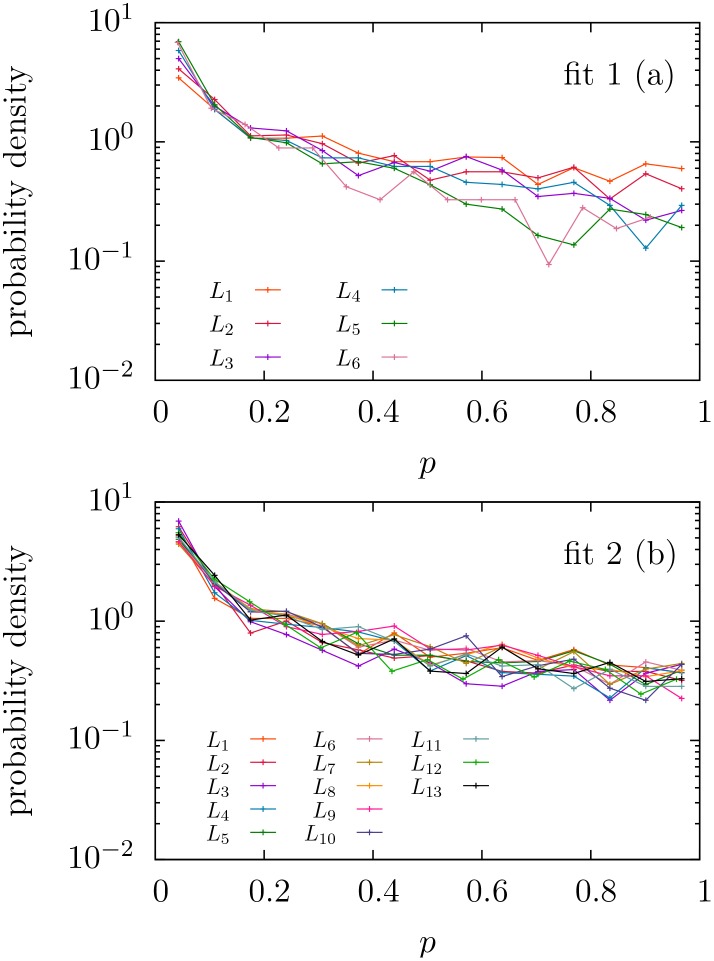
Fig 5. Estimated probability density functions of p-values conditioned to p ≥ 0.01 separating for different ranges of text length L. p-values correspond to the fitting of word frequencies to (a) distribution f1 and (b) distribution f2.
We divide the distribution of text length into 15 intervals of 2 000 texts each. For distribution f1 only the first seven groups (up to length 34 400) are displayed (beyond this value we do not have enough statistics to see the distribution of p-values greater than 0.01, as displayed in Fig 6; for distribution 2 this happens only in the last two groups). The intervals Li range from L1 = [115, 5291] to L6 = [25739, 34378] and to L13 = [89476, 103767].

