Fig 1.
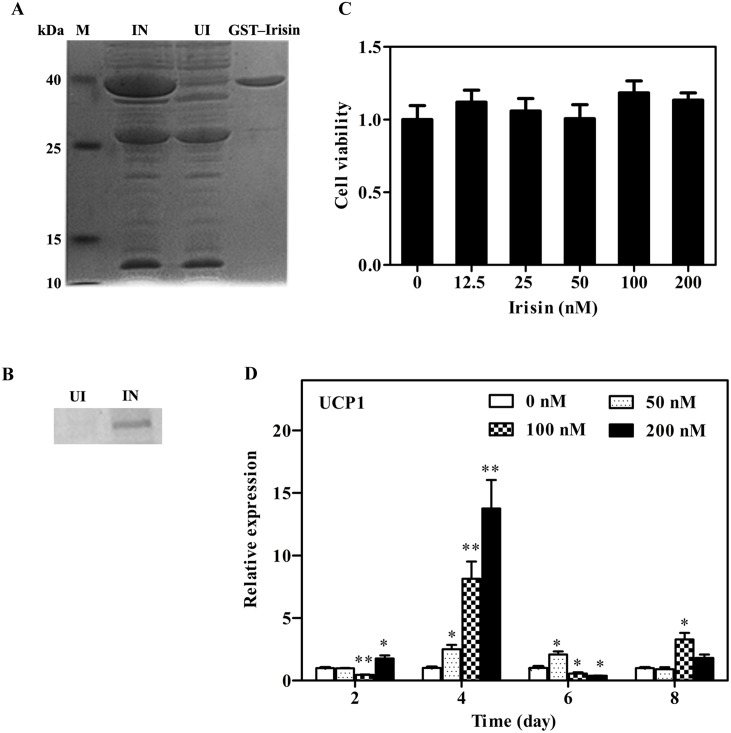
A: SDS-PAGE analysis of pGEX-4T-1–irisin expression and purification. M: low molecular weight marker (kDa); IN: induced culture; UI: un-induced culture; GST-Irisin: the purified eluent. B: Western Blotting of GST-irisin. IN: induced culture; UI: un-induced culture. C: Effect of GST-irisin on 3T3-L1 preadipocytes. 3T3-L1 preadipocytes were treated with various GST-irisin concentrations (0, 12.5, 25, 50, 100, and 200 nM), and the cell viability was assessed using the CCK-8 assay. D: qPCR of UCP1 of 3T3-L1-derived adipocytes. 3T3-L1 mature adipocytes were cultured with various GST-irisin concentrations (0, 50, 100, and 200 nM). The expression of UCP1 mRNA was determined by qPCR. Values are expressed as the mean ± SD of three independent experiments. *P < 0.05 versus control; **P < 0.01 versus control.

