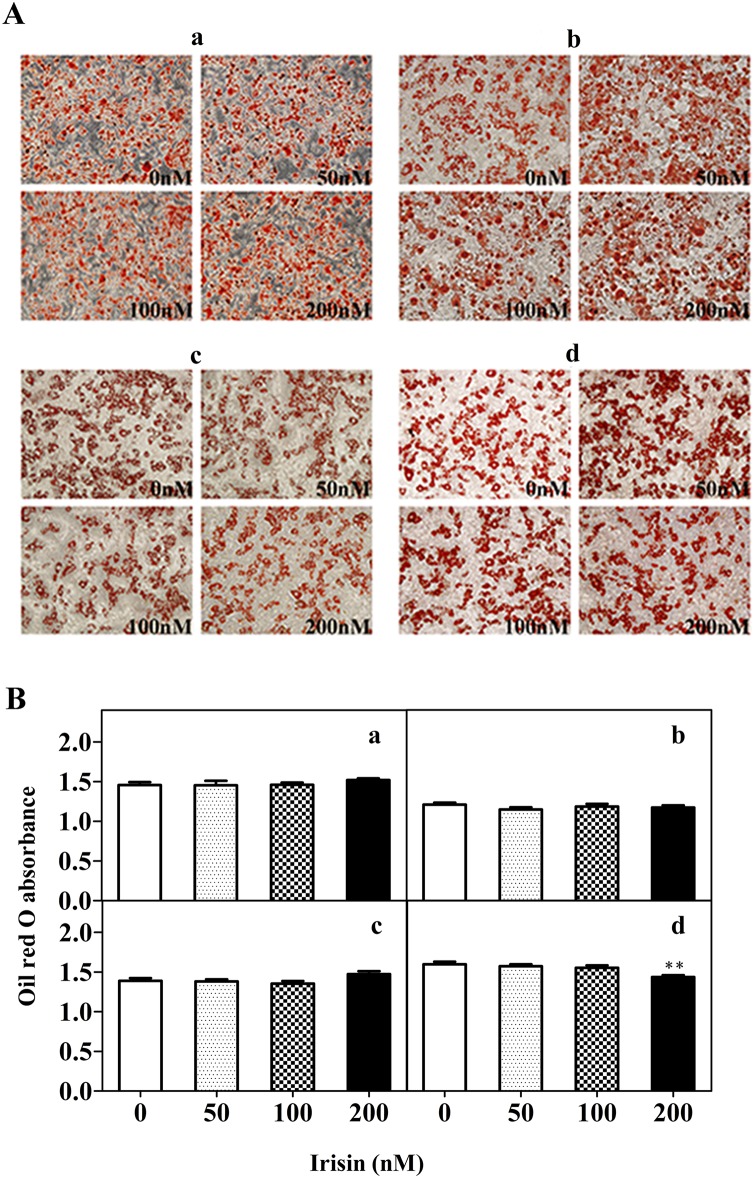
Fig 2. Fat droplets in control and treated groups.
3T3-L1 mature adipocytes were cultured with various GST-irisin concentrations (0, 50, 100, and 200 nM) for 2 (a), 4 (b), 6 (c) and 8 (d) days. A: Oil Red O staining (200×). B: OD values of isopropanol extraction. Values are expressed as the mean ± SD of three independent experiments. **P < 0.01 versus control.

