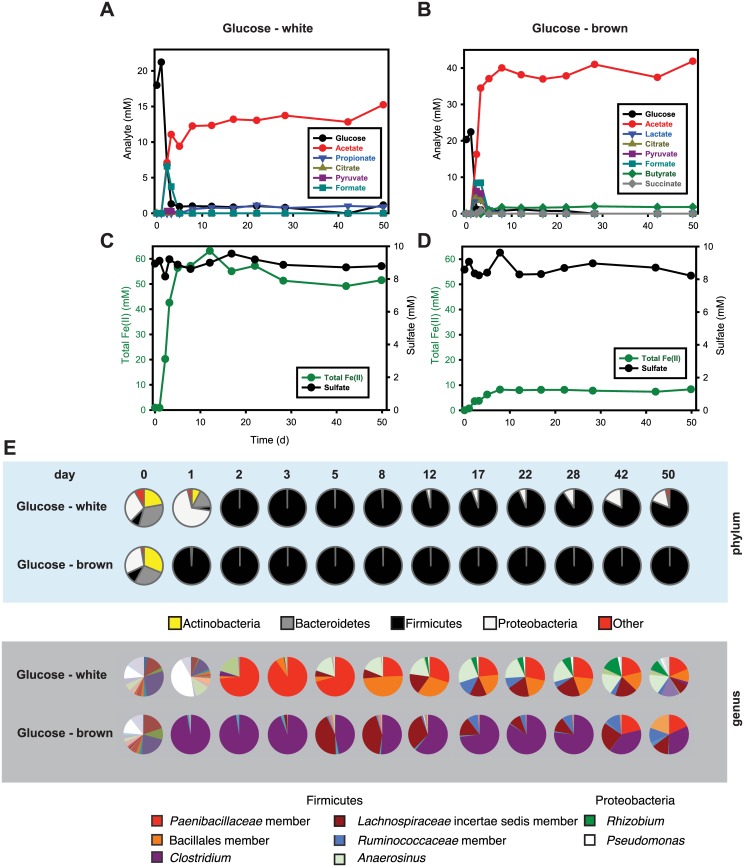
Fig 4. Glucose consumption and organic acid production (panel a) and total Fe(II) production and sulfate reduction (panel c) in the presence of glucose (20 mM), for the glucose “white” system (see main text).
Glucose consumption and organic acid production (panel b) and total Fe(II) production and sulfate reduction (panel d) in the presence of glucose (20 mM), for the glucose “brown” system (see main text). Both incubations were started with 50 mM of two-line ferrihydrite and 10 mM of sulfate. The data are based on a single replicate for each bottle. Bacterial community changes over time are shown as pie charts in panel e. Again, similar compositions at day 0 for both communities (leftmost pie chart) contrast with the distinct community compositions observed for the two systems at both the phylum and genus levels. Labeled organisms are those discussed further in the main text.

