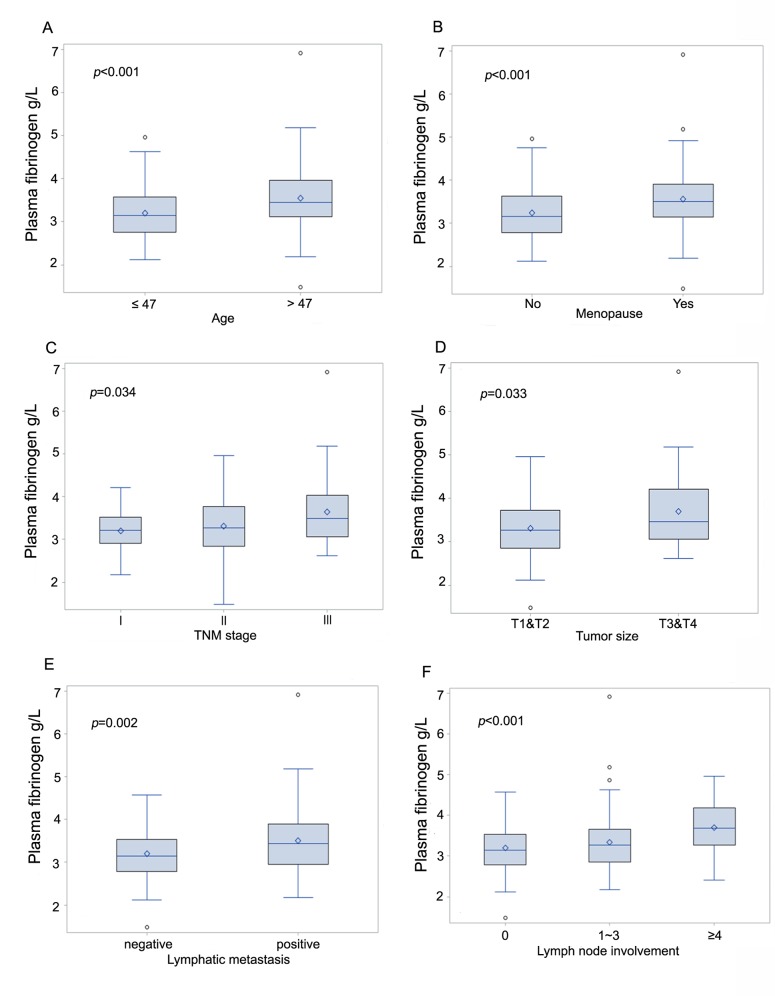
Fig 1. Box plots indicating the distribution of the pretreatment plasma fibrinogen levels and the following clinicopathological parameters: age (A), menopause (B), tumor stage (C), tumor size (D), lymphatic metastasis (E), and lymph node involvement (F).
The horizontal bar in the box indicates the median value, the box indicates the 1st (25%) and 3rd (75%) quartile, the whiskers indicate 5–95%, the open circles indicate the outlier

