Figure 4.
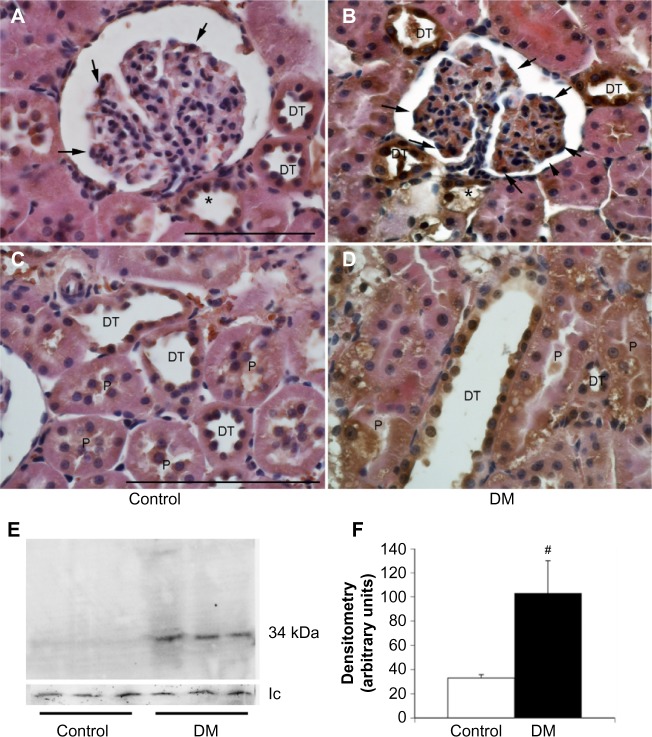
The expression of the prorenin receptor in normal and diabetic rats.
Notes: Immunohistochemical analysis of the prorenin receptor in podocytes (arrows), proximal tubules (P), macula densa (asterisks), and distal nephron including cortical collecting ducts (DT), appeared increased in diabetic rats (B and D) compared with controls (A and C). This was confirmed by the results of a Western blot analysis (E and F). #P<0.05 vs control. Bar: 100 μm.
Abbreviations: DM, diabetes mellitus rats; lc, loading control.

