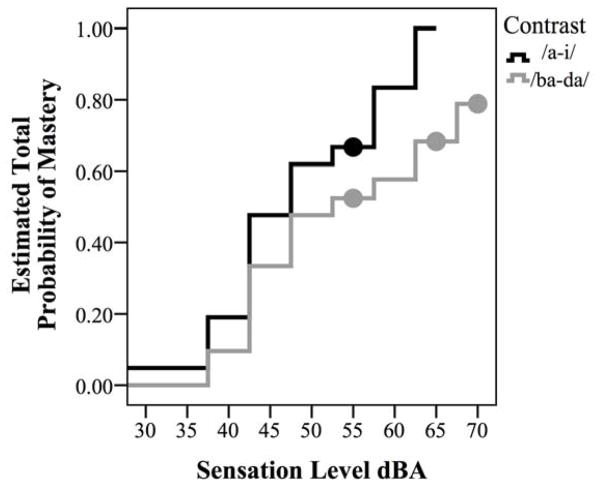
Figure 2.
Probability functions for discrimination criterion across sensation level (SL)
Note. The Kaplan-Meier probability functions for /a-i/ and /ba-da/. The likelihood of achieving the discrimination criterion increases for both contrasts as SL increases with an advantage for /a-i/. The solid dots on the curves mark the maximum SL tested for the infants who did not reach criterion by the end of data collection.

