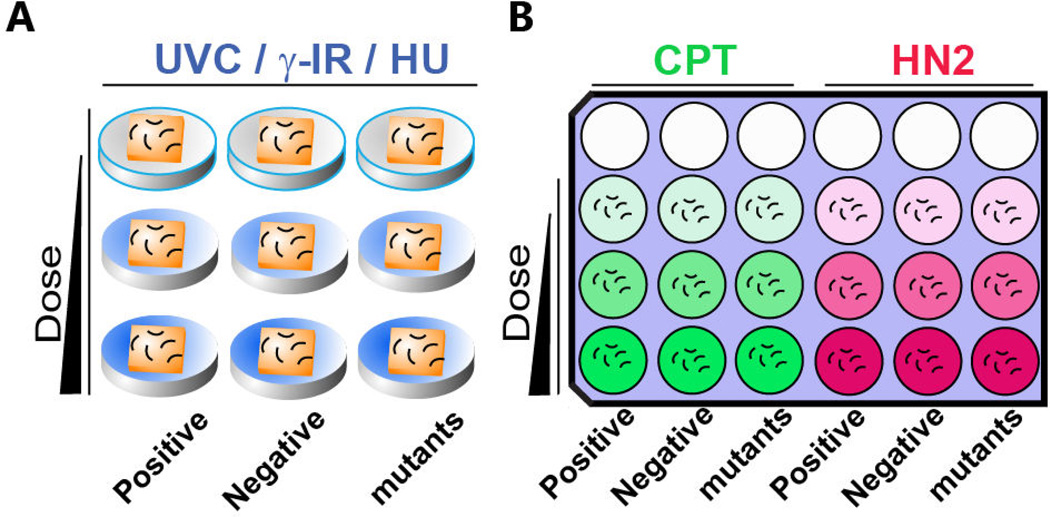
Figure 2. A schematic representation of DNA damage sensitivity assay design with solid (A) and liquid (B) exposure.
A. For UVC, γ-IR and HU treatments, animals are exposed on seeded solid NGM media. B. One set of 9 wells is used for CPT (Green) or HN2 (Red) sensitivity. Animals are exposed to genotoxins suspended in liquid culture. Dose of genotoxin is indicated by the gradient color. Empty circles indicate empty wells. Positive (known sensitive mutants, see Table 1) and negative controls (wild type N2) as well as mutant worms are incubated in the indicated column. Short curved lines represent animals in panels A and B. Squares represent bacterial lawns in panel A.

