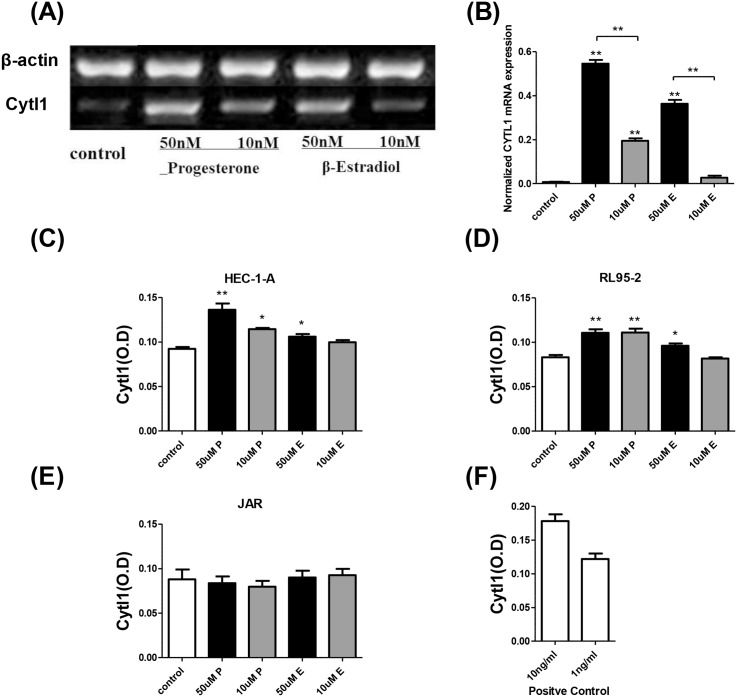
Fig 2. The effects of ovarian hormones on endometrial Cytl1 expression.
(A) Reverse-transcription PCR analysis of Cytl1 mRNA expression in vitro after treatment with ovarian hormones or control (B). Greyscale analysis of Cytl1 expression relative to β-actin expression. Cytl1 protein expression regulated by ovarian hormones or control were analyzed by ELISA in human endometrial cell lines HEC-1-A (C), RL95-2 (D) and the human trophoblastic cell line JAR. (E) Cytl1 expression levels are represented by OD450 values, and (F) the positive control represents the result of standard sample detected by ELISA. Data shown for each sample are average of results from three array wells. P, progesterone; E, estradiol. Data represent mean±SEM. *P < 0.05; **P < 0.01.

