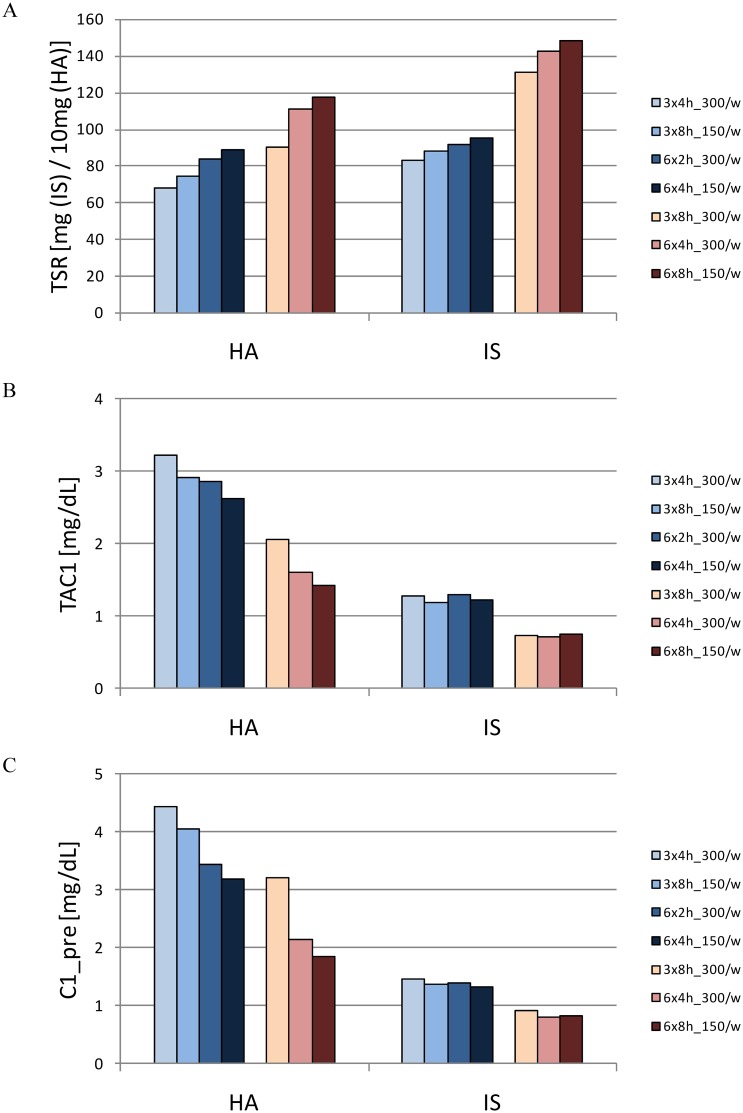
Fig 4. Adequacy in different dialysis strategies.
Total solute removal (TSR—panel A), time-averaged concentration (TAC1—panel B) and predialysis concentration (C1_pre—panel C) of hippuric acid and indoxyl sulfate for seven different dialysis strategies. The different shades of blue and red, respectively, refer to the regimes with less and more processed blood as compared to 3x4h_300/w. The two darkest bars on the right of each series refer to the more frequent dialyses. [TSR in 101mg (HA) and mg (IS); TAC1 and C1_pre in mg/dL]. [3x4h_300/w: thrice weekly 4h dialysis with QB300; 3x8h_150/w: thrice weekly extended (8h) dialysis with QB150; 6x2h_300/w: frequent (6 times) short (2h) dialysis with blood flow QB300; 6x4h_150/w: frequent 4h dialysis with QB150; 3x8h_300/w thrice weekly extended dialysis with QB300; 6x4h_300/w: frequent 4h dialysis with QB300; 6x8h_150/w: frequent extended dialysis with QB150].

