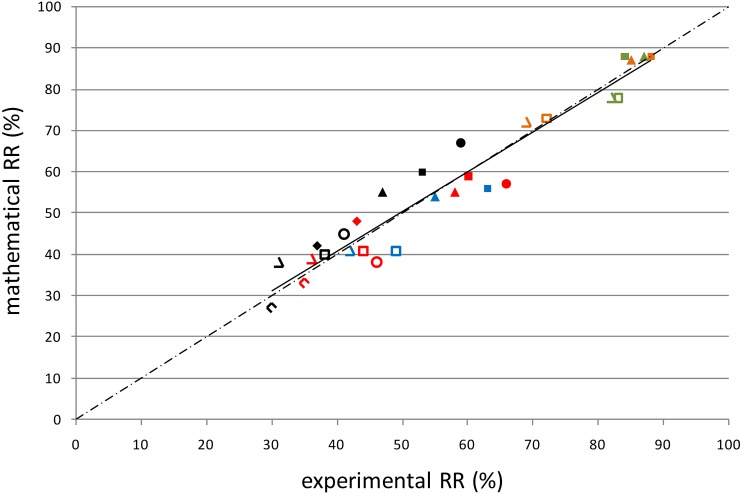
Fig 5. Model validation.
Correlation (R = 0.942; P<0.001) between the reduction ratios as measured in vivo and those as derived from mathematical analyses for the different protein-bound solutes [PCG (green), HA (orange), IAA (blue), IS (red), and PCS (black)] and the different dialysis strategies [4h HD (open diamonds) and 8h HD (filled diamonds) for correlation with the study of Meijers et al.; low KOA (open circles) and high KOA (filled circles) for correlation with the study by Sirich et al.; 4h hemodialysis HD (open triangles), 8h HD (closed triangles), 4h hemodiafiltration HDF (open squares), and 8h HDF (filled squares) for correlation with our own in vivo data].

