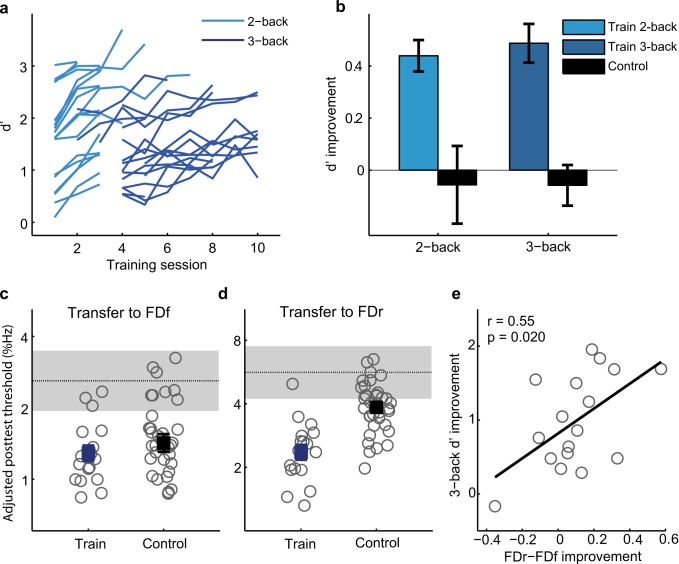
Fig 4. WM training and transfer to FD.
(a) Multiple-session training on the Tone n-back task (N = 17), with n first fixed at 2 (light blue lines) and then 3 (dark blue lines). (b) Pre- and posttest d’ for Tone 2- and 3-back. Only twelve of the control group (N = 36) were tested on the 2-back condition. (c) Transfer to FDf. Plotted are individual (grey circles) and group mean (filled squares) posttest thresholds, adjusted for differences in pretest thresholds. The horizontal dotted line and the grey patch indicate mean pretest threshold and 95% confidence interval. (d) Transfer to FDr. (e) Correlation between WM improvement and reduction of the influence of variability (FDr–FDf) in the trained participants.

