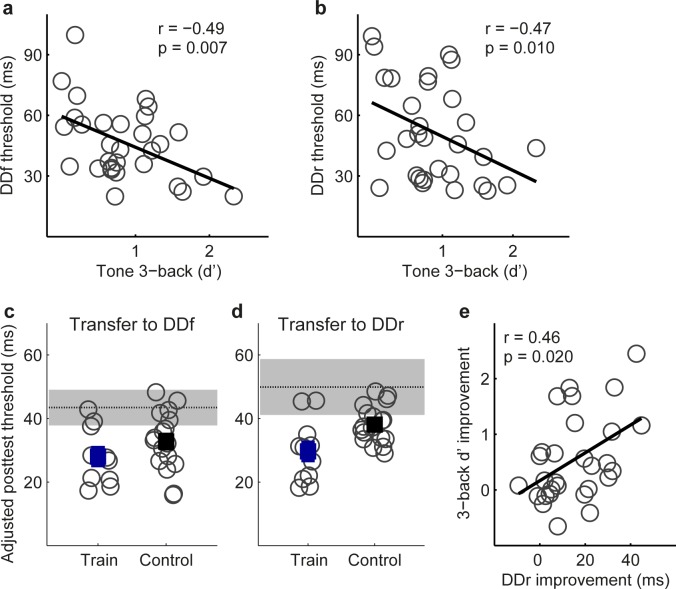
Fig 6. Transfer from Tone n-back to tone duration discrimination.
(a, b) Correlation of DDf and DDr thresholds with Tone 3-back performance before training. (c, d) Individual (grey circles) and group mean (filled squares) posttest thresholds of the trained participants (N = 11) and controls (N = 15) on DDf and DDr, adjusted for differences in pretest thresholds. The horizontal dotted line and the grey patch indicate mean pretest threshold and 95% confidence interval. (e) Correlation of Tone 3-back and DDr improvements.

