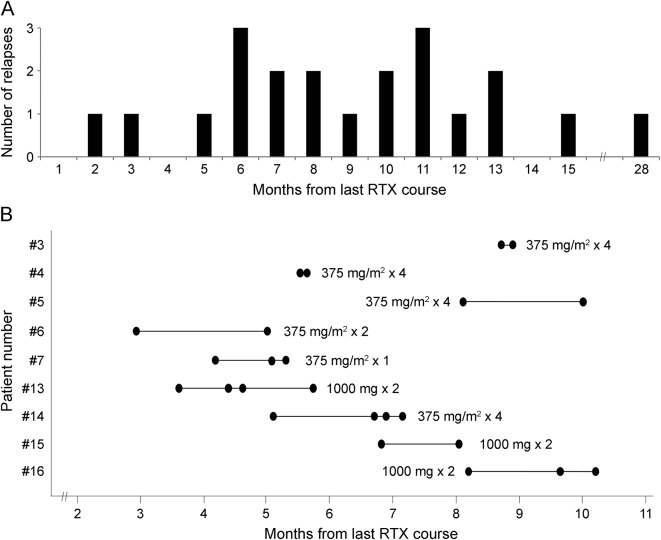
Figure 2. Time to relapse and time to B cell repopulation after rituximab.
(A) Relapses during rituximab (RTX) treatment according to the time from last rituximab course (total 21 relapses in 10 patients). (B) Inter- and intraindividual variability in the time to B cell repopulation after rituximab in 9 patients. To assess the variability in the intraindividual time to repopulation, these 9 patients were selected based on the availability of at least 2 rituximab courses with evidence of a repopulated CD19 count after demonstrated depletion and the fact that the same dose regimen was administered (rituximab regimen specified for each patient next to the bar). The horizontal bars represent the range of intraindividual variability in the time to repopulation, and the dots represent the actual measurements. There is significant variability between patients, although the intrapatient variability appears to be less.

