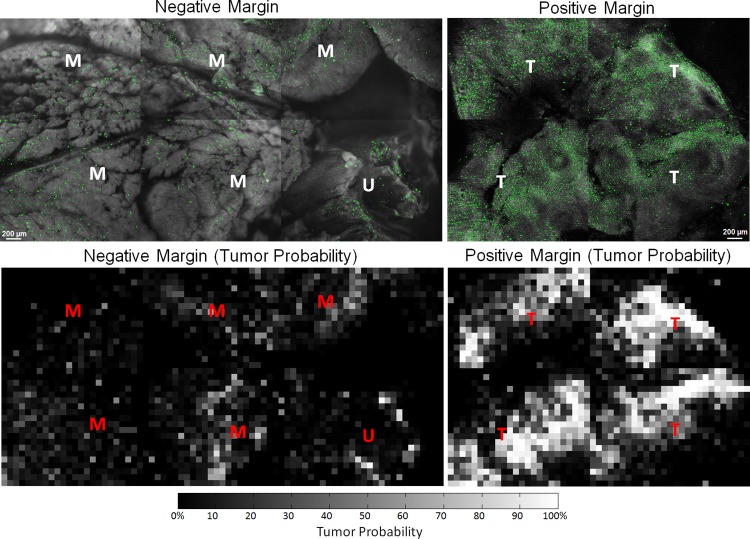
Fig 10. Full margin images acquired with the SIM system.
Representative images of a positive margin and negative margin diagnosed through H&E sections. These SIM images shown here have also been analyzed with MSER and the segmented regions are highlighted in green. In addition, specific tissue types were identified by the pathologist in the SIM images and labeled with T (tumor), M (muscle), A (adipose), and U (unknown). The corresponding grid analysis and tumor probability are also displayed as heatmaps.

