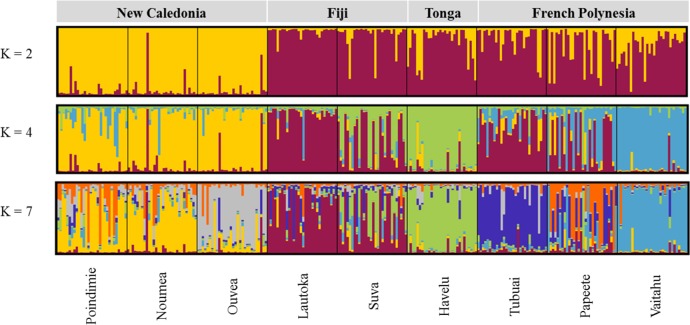
Fig 3. Model-based clustering of 270 Ae. aegypti individuals using STRUCTURE software.
Each individual is represented by a single vertical line; sample sites are separated by a black line; the whole sample is divided into K colors representing the number of clusters assumed. The colors show the estimated individual proportions of cluster membership.

