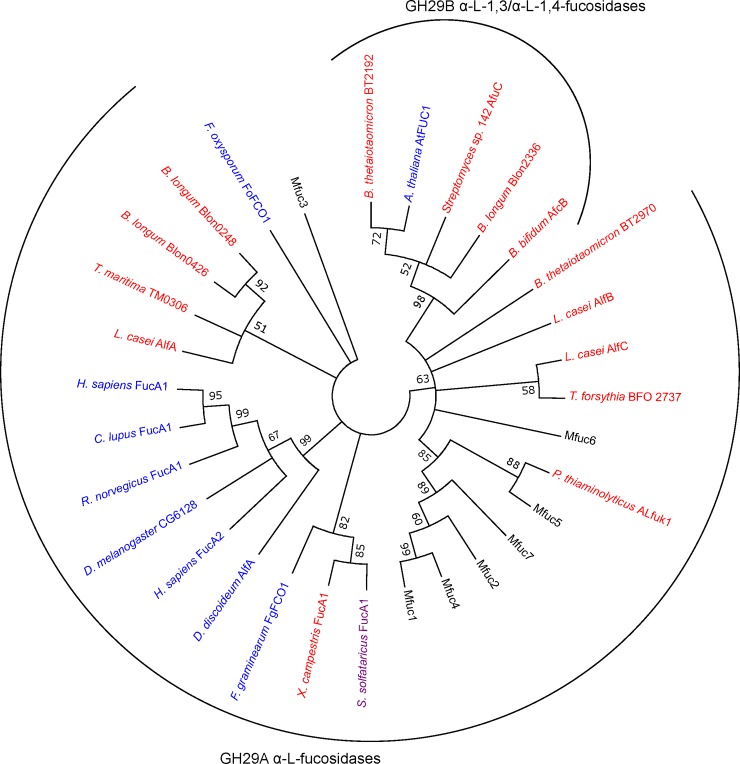
Fig 1. Phylogenetic tree of novel α-L-fucosidase sequences, Thma and characterised representatives of GH 29 family.
Phylogeny was inferred using the neighbour-joining method. The percentage of replicate trees (>50%) in which the associated taxa clustered together in the bootstrap test (500 replicates) are shown next to the branches. Bacterial α-L-fucosidases are shown in red, eukaryotic in blue and the archeal α-L-fucosidase in purple. Accession numbers for the enzymes included in the analysis are provided in the materials and methods section.

