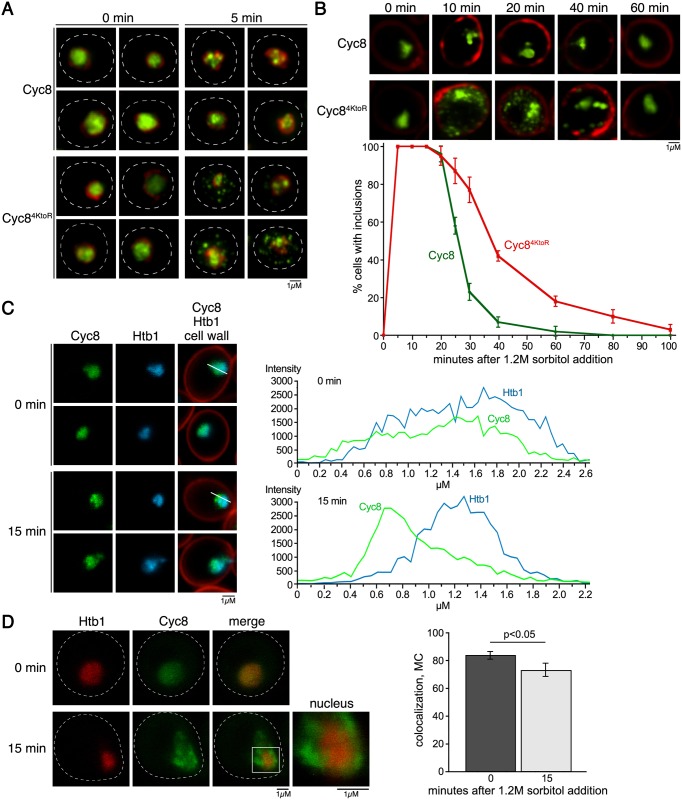
Fig 9. Cyc8 inclusions form in the nucleus during hyperosmotic stress.
(A) Structured Illumination Microscopy (SIM) images of cells subjected to 0 or 5 minutes of hyperosmotic stress (1.2M sorbitol). Wild-type or mutant Cyc8 is GFP-tagged and Nup53 is mCherry-tagged. (B) SIM images of cells during a 60 minute time course of hyperosmotic stress (1.2M sorbitol). Wild-type or mutant Cyc8 is GFP-tagged, and the cell wall is stained with Calcofluor White. Graph shows the percentage of cells with inclusions over time. (C) Confocal 3D images of cells subjected to 0 or 15 minutes of hyperosmotic stress (1.2M sorbitol). Wild-type Cyc8 is GFP-tagged and histone H2B (Htb1) is mCherry-tagged. Graph shows the intensity of Cyc8 or Htb1 across the white line drawn on the cells to the left. (D) Confocal 3D images of cells expressing Cyc8-GFP or Htb1-mCherry. Graph to the right shows the Mander's overlap coefficient [56,57] for the colocalization of the proteins during 0 and 15 minutes of hyperosmotic stress (1.2M sorbitol).

