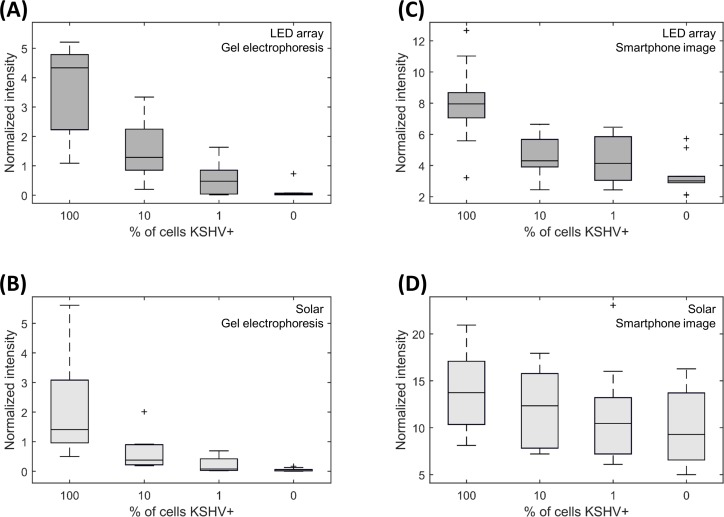
Fig 4. Pseudo-biopsy amplification results.
(A, B) Results when analyzed by standard gel electrophoresis. (C, D) Results when analyzed by smartphone image (as seen in Fig 1E). 40 trials were completed with each of the two heating methods, with 10 trials at each of four KSHV+ concentrations (overall number of trials: 80). Data represented by darker boxes (A, C) were heated indoors by LED array, while data represented by lighter boxes (B, D) were heated outdoors via sunlight. Box plots were made with standard conventions: boxes range from the 25th to 75th percentiles, and whiskers extend to a maximum of 1.5x the interquartile range.

