Abstract
In vivo degradation predication faces a huge challenge via in vitro corrosion test due to the difficulty for mimicking the complicated microenvironment with various influencing factors. A thin electrolyte layer (TEL) cell for in vitro corrosion of pure magnesium and AZ91 alloy was presented to stimulate the in vivo corrosion in the micro-environment built by the interface of the implant and its neighboring tissue. The results demonstrated that the in vivo corrosion of pure Mg and the AZ91 alloy was suppressed under TEL condition. The AZ91 alloy was more sensitive than pure Mg to the inhibition of corrosion under a TEL thickness of less than 200 µm. The TEL thickness limited the distribution of current, and thus localized corrosion was more preferred to occur under TEL condition than in bulk solution. The TEL cell might be an appropriate approach to simulating the in vivo degradation of magnesium and its alloys.
Keywords: magnesium, corrosion, thin electrolyte layer, biomaterials
Introduction
Pure magnesium [1, 2] and its alloys such as Mg-Al [3], Mg-Zn [4], Mg-Mn [5], Mg-RE [6], Mg-Ca [7] and Mg-Li [8] are promising biodegradable biomaterials for cardiovascular stents [9] and orthopedic implants [10, 11] due to their outstanding biocompatibility, biomechanical compatibility and osteoinduction [12, 13]. The screening and in-service life span predication of newly developed magnesium implants require cost-effective in vitro and in vivo tests, especially for degradation tests at an early stage in their development [14].
Biodegradation refers to corrosion occurring on the magnesium replacements as exposed to body fluid [15]. Usually, the corrosion performance of magnesium and its alloys can be assessed using a variety of in vitro corrosion methods such as immersion mass loss, hydrogen evolution and electrochemical polarization tests together with electrochemical impedance spectroscopy in bulk simulated body solutions [16]. However, the above measures cannot well-evaluate the in vivo degradation rate of magnesium due to the complicated factors including material, chemical, mechanical and biological aspects.
To date, a considerable number of in vitro degradation investigations have been made, involving the influencing factors, such as inorganic ions [3, 17], proteins [18], amino acids [19], glucose [20], corrosion medium volume [21], extraction condition [22], blood flow [23], cells [24, 25], tissues [26], pH [27] and pH buffers[28]. The degradation rate is much bigger in saline solution than in E (Earle's solution containing calcium and magnesium salts)-MEM (Eagle's minimum essential medium)-FBS (fetal bovine serum), which is the closest solution to human blood plasma. Protein adsorption and insoluble salt (i.e., carbonate, phosphate, Ca-P) formation retarded magnesium degradation, whereas organic compounds such as vitamins, amino acids, glucose and albumin as well as cell [29] promote the dissolution of magnesium [18–20]. Also, the degradation rate is influenced by buffering solutions, which buffered with N-2-hydroxyethylpiperazine-N'-2-ethane sulfonic acid (HEPES) and NaHCO3 leads to an increase and decrease in the degradation rate, respectively [30]. The Earle's balanced salt solution buffered with sodium bicarbonate provides a degradation rate comparable to those observed in vivo [31].
While the in vivo degradation of magnesium implants is characterized by mass loss based on the volume loss derived from the three-dimensional (3D) reconstruction using synchrotron radiation based micro-computed tomography (μ-CT) [12]. Nevertheless, this methodology has several limitations: (i) it cannot tell the corrosion product from the new bone, thus the volume of the corrosion products cannot be removed; (ii) the average mass loss rate cannot reflect the actual degradation rate due to pitting corrosion usually occurs on magnesium alloys and (iii) the degradation of the implanted magnesium alloys was suppressed by protein and cellular/tissue encapsulation [32] due to more difficult diffusion of the species in the microenvironment. Therefore, the degradation rate of magnesium obtained from μ-CT may be different, to some extent, from the in vitro corrosion tests [12].
Moreover, the in vivo degradation rate of Mg alloys varies with different implantation positions or anatomical locations in the body [26, 33]. For instance, it is higher in the femur than in the muscle (subcutaneous tissue). The deposition layer resulted from the degradation of the alloy bar, positioned in the bone marrow cavity, suffers from the removal from body fluid [26] due to the faster corrosion rate and higher pH increase under the flow condition than the static condition [23]. This finding implies that the geometrical dimensions of the electrochemical cell have a significant impact on degradation behavior of the Mg implants. However, few in vitro studies refer to the influence of the implanted positions or the geometric dimensions of the electrochemical cell on degradation rates of the Mg replacements [1, 2].
Usually, the conventional in vitro corrosion tests are performed in bulk solutions, while the in vivo degradation occurs in the microenvironment on one hundred micrometer scale [34], constructed by the implant and its surrounding tissue during the bone-healing process. Namely, the microenvironment can be regarded as a thin electrolyte layer (TEL), the thickness of which is lower than a few hundreds of micrometers, achieved by mechanically confining the desired distance or thickness between the surface of working electrode (WE) and a parallel waterproof wall [35].
Since the conventional or traditional in vitro corrosion in bulk cell cannot be used to well-predict in vivo corrosion rates of magnesium alloys due to the ignorance of geometric factor of electrochemical cell [12], it is thus of importance to establish a novel in vitro methodology for evaluating the corrosion resistance of magnesium and its alloys [15, 36]. The new methodologies should genuinely reflect the influence of the tissue in the microenvironment on corrosion behavior of the orthopedic magnesium implants.
Fortunately, the TEL technique has been successfully applied to investigate the atmospheric corrosion of the alloys such as Fe-Ni [37], aluminum [38], magnesium [39, 40] and copper alloys [41, 42]. It is well known for atmospheric corrosion electrochemical reaction generally occurs between micro-anodes and micro-cathodes under TEL [39]. A great change in the TEL thickness markedly affects a considerable processing such as the potential distribution, mass transport and release of metallic ions and accumulation of corrosion products [37]. Also, it is observed that the hydration of dissolved metal ions, especially the accumulation of the secondary corrosion products [41]. This particular geometry results in specific galvanic coupling and local pH variation [37]. Chen et al. [43] claimed that the anodic and cathodic processes of the corrosion of Mg-10Gd-2Y-0.4Zr alloy were both retained under TELs. The corrosion was more localized under TEL than in bulk solution, despite the cathodic process still dominated by hydrogen evolution reaction. The decrease in corrosion rate of Mg-10Gd-2Y-0.4Zr alloy with the decrease in layer thickness, which is ascribed to the inhibition of the rate of pit initiation and the decrease in probability of pit growth.
In view of the specific corrosion behavior under TEL, we design an electrochemical cell to simulate thein vivo corrosion for magnesium and its alloys based on the fact that the orthopedic implants are covered with fibrous capsule, interstitial region and muscles [32, 44]. And the interstitial region is filled with body fluids between the implant and the muscle, the thickness of the interstitial region maintains at dozens to hundreds of micrometers [32]. The body fluid layer is closely related to the surface of the degradable implants [12]. Therefore, the interstitial region can be simplified as a TEL model to mimic the in vitro microenvironment. The TEL tests may be an appropriate approach to mimic the in vivo degradation of magnesium and its alloys, on the basis of the results from TEL [35, 38, 45] and no match for corrosion rates of in vivo and in vitro tests [39, 42]
The purpose of this study is to apply the TEL cell for characterizing the in vitro corrosion rate of magnesium and its alloys and to open a new window for mimicking the in vivo corrosion test of magnesium and its alloys, concerning with the influence of geometric dimensions of electrochemical cell on degradation behavior.
Experimental
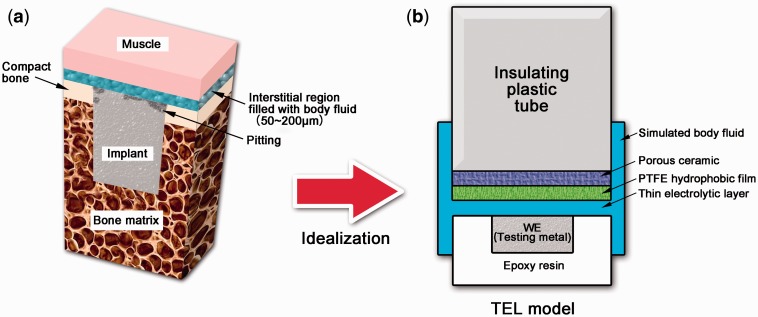
Figure 1a schematically illustrates the microstructure of an orthopedic implant and its neighboring bone. The implant was firstly threaded into the compact bone (white part), then embedded into the bone matrix (brown part) during the in vivo tests. And the top was covered by the fibrous capsule (not given in figure), the interstitial region (blue part) and the muscle (pink part). The interstitial region with a thickness of 50∼200 μm was filled with body fluids and had a physical contact with the implant surface. The muscle would further hinder the mass transfer in the body fluids. Therefore, the in vivo microenvironment of the orthopedic implant can be idealized to a TEL model (Fig. 1b). The magnesium implant was the WE. The interstitial region and the muscle were simulated by the TEL and polytetrafluoroethylene (PTFE) hydrophobic film, respectively. The specifically designed structure could diminish the influence of the surface tension of the electrolyte to maintain a thinner electrolyte thickness than the open cell [39, 41], and the PTFE hydrophobic film maintained a stable TEL on the surface of WE (Fig. 1b).
Figure 1.
(a) schematic illustration of the microstructure of implant and bone and (b) the TEL model to mimic in vivo microenvironment
Prior to testing, commercial as-cast pure Mg (with a purity of 99.92 wt. %) and AZ91 alloy (compositions: 8.5–9.5 wt. % Al, wt. 0.45–0.9% Zn and balanced Mg) were embedded in epoxy resin as the WE and ground to 2000 grit, then inserted into a special sample stage in the electrolytic cell setup, as shown in Fig. 1. A three-electrode system was applied. The WE, saturated calomel electrode as the reference electrode and a platinum wire as the counter electrode were connected with an electrochemical workstation (PARSTAT 2273, Princeton Applied Research). All the polarization measurements were performed in Hank’s solution at a scan rate of 1 mV/s at room temperature. The area of the WE exposed to the solution was 1 cm2. Triple measurements were conducted for each group.
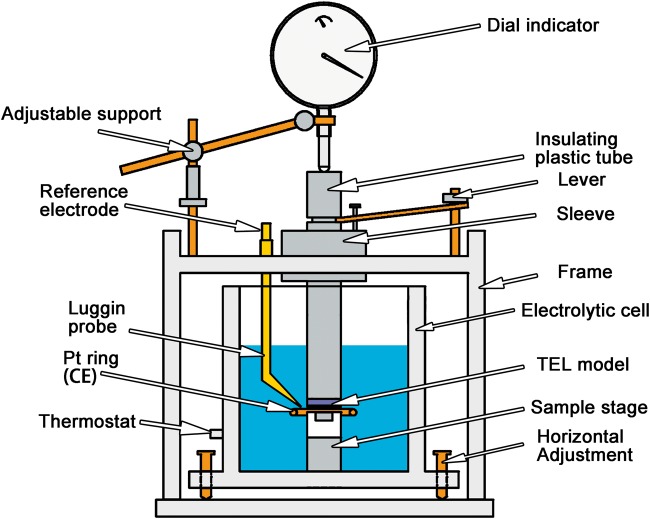
The PTFE-made tube was fixed on the frame to restrain the insulating plastic tube moving up and down along the Z axis. Three horizontal adjusting screws were placed on the bottom of the electrolytic cell to ensure planar parallelism between the top surface of the sample and the bottom of the insulating plastic tube. The plastic tube and the sample stage constituted the core of the TEL cell, as shown in Fig. 2. A pair of levers was used to control the TEL thickness by regulating the height of the plastic tube on Z axis. When the bottom of the plastic tube was dropped down on the top surface of the sample, the dial indicator reading was set as zero and then the plastic tube was lifted, the dial indicator directly designated the TEL thickness
Figure 2.
schematic illustration of the TEL device
The open circuit potential (OCP) measurement firstly lasted 3 min in the bulk Hank’s solution and then the TEL thickness was adjusted to a specific value, and consequently, the electrochemical experiments were conducted in triplicates for each TEL thickness.
The samples were polished and etched by natal to disclose their microstructures prior to the electrochemical tests such that to understand the influence of microstructure, particularly the secondary phase on corrosion. And then a 3D contour profiler (Zeta-200, Zeta Instruments Inc.) was employed to discern the change in surface morphology of the pure Mg sample and the AZ91 alloy before and after the electrochemical experiments.
Results and Discussion
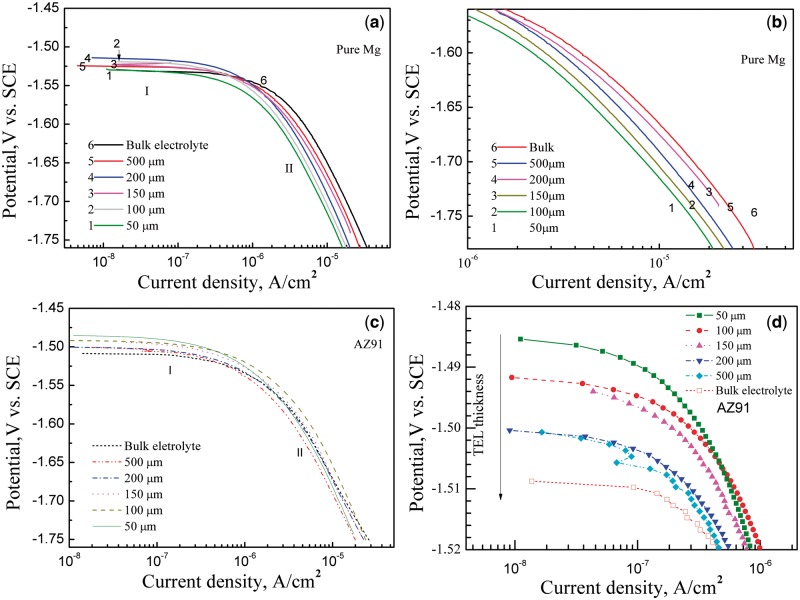
Figure 3a and b presents the cathodic polarization curves of the pure Mg sample at various TEL thicknesses. The curves of corrosion current density, Icorr as a function of the TEL thickness experienced two different stages. The cathodic current density under TEL is smaller than that of the bulk solution. Namely, the Icorr of pure Mg decreased with a decrease in TEL thickness (Fig. 3b), regardless of the reversed tendency for the 150-μm and 200-μm TELs. The result indicates that the TEL leads to the inhibition of cathodic process by the hydrogen reduction, which relates to the uneven distribution of current due to the reduced effective electrode area in the TEL in comparison with the bulk solution [38].
Figure 3.
cathodic polarization curves of (a, b) pure Mg and (c, d) AZ91 alloy under TEL condition with various thicknesses of electrolyte layer. The TEL with a thickness of 1000 μm is regarded as the bulk solution [37]
Interestingly, the cathodic polarization curves of pure Mg almost had close Tafel slopes (Fig. 3b) under various thicknesses of TEL to the bulk solution. The OCPs of the TEL, except for the 50-μm TEL, were higher than that of the bulk solution. This scenario means the inhibition of anodic process probably results in the rise in OCPs. Generally, the TEL prohibited the cathodic and anodic processes of pure Mg in Hank’s solution.
Generally, the Icorr of pure Mg increased with an increase in TEL thickness (Fig. 3a and b) except for the exchange of the thickness of 150 μm and 200 μm. Similarly, with decreasing TEL thickness, the Icorr of the AZ91 alloy reduced; and the OCPs was shifted toward more noble direction (Fig. 3c and d). The OCPs for the AZ91 alloy may be related to the formation of a corrosion product layer on the surface of the AZ91 alloy and the inhibition of anodic process (Fig. 3d) [39].
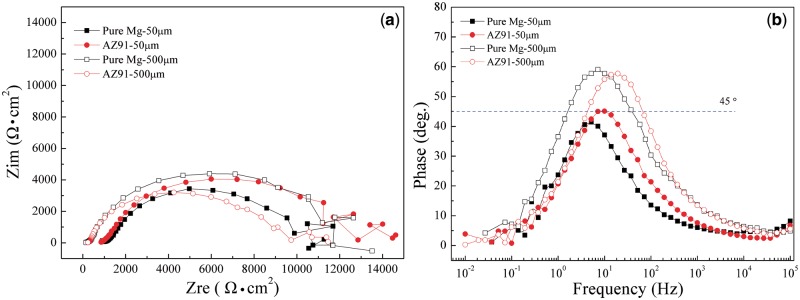
Furthermore, electrochemical impedance spectroscopy measurements were conducted with TEL thicknesses of 50 μm and 500 μm. Figure 4a and b provided Nyquist and Bode phase plots of pure Mg and the AZ91 alloy at thicknesses of 50 μm and 500 μm, respectively. The Nyquist plot (Fig. 4a) designates that the TEL gave rise to a higher solution resistance, the scattered data at low frequency region also means the instability of the TEL and the extremely difficult diffusion process of the H+ ions under such a TEL due to the influence of the uneven distribution of current [45]. It is suggested that the current distribution would be uneven if the phase angle was less than 45° [46], whereas the phase angle greater than 45° designates the electrolyte film is continuous on the surface of the samples and uniform distribution of current.
Figure 4.
(a) nyquist plots and (b) bode phase plots of pure Mg and AZ91 alloy in region I (50 μm) and region II (500 μm).
It is clear that the current distribution was uneven under 50-μm TEL (Fig. 4b) for both pure Mg and the AZ91 alloy due to the fact that the micro-galvanic corrosion between the impurity/Mg17Al12 phase and the α-Mg phase was susceptible to the uneven distribution of current. On the contrary, the current distribution was more uniform under the 500-μm TEL condition.
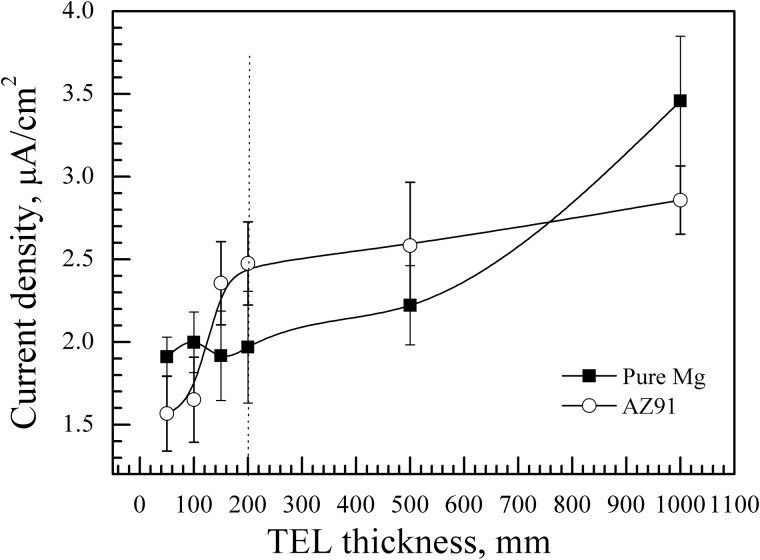
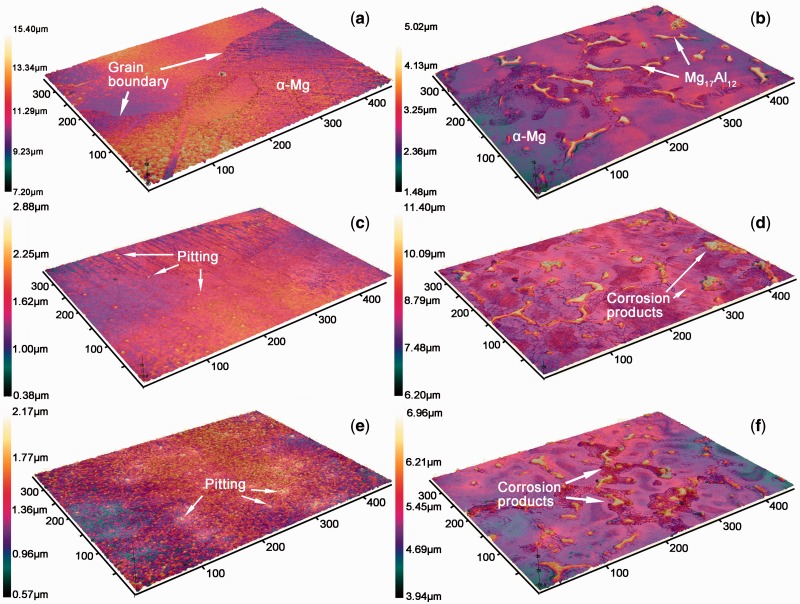
Generally, the TEL inhibited, to some extent, the corrosion of both pure Mg and the AZ91 alloy, as shown in Fig. 5. When the thickness was not greater than 100 μm, the Icorr of the pure Mg sample was higher than that of the AZ91 alloy. This scenario is due to the fact that more severe pitting corrosion occurred on the surface of the pure Mg samples rather than the AZ91 alloy (Fig. 6), on which no remarked change happened.
Figure 5.
plots of corrosion current density of pure magnesium and AZ91 alloy as a function of TEL thickness
Figure 6.
three-dimensional images of (a) pure Mg and (b) AZ91 alloy before the corrosion and (c) pure Mg and (d) AZ91 alloy under TEL with a thickness of 50 μm and (e) pure Mg and (f) AZ91 alloy under TEL with a thickness of 500 μm
Moreover, the hydrogen reduction current density of pure Mg had not marked change when the TEL thickness is within 200 μm. But for the AZ91 alloy, there was a rapid increase in Icorr at the electrolyte layer thickness of 150 μm. When the TEL thickness was greater than 200 μm, the Icorr of the AZ91 alloy increased slowly with the increasing TEL thickness. That is, there is a linear relationship between the corrosion current density and the TEL thickness for the AZ91 alloy as the TEL thickness is not less than 200 μm. The scenario is attributed to the larger volume fraction and higher potential of the second phases (β phases). The big potential discrepancy between the β phase and the α-Mg matrix led to micro-galvanic corrosion between α and β phases in the AZ91 alloy. And the TEL caused the rapid formation of Mg(OH)2 corrosion product due to the fact that cathodic process was predominately controlled by diffusion of H+ ions, which was restricted by TEL. Thus, the corrosion of the AZ91 alloy was inhibited in comparison to the pure Mg sample.
Anodic reaction:
| (1) |
Cathodic reaction:
| (2) |
Total reaction:
| (3) |
In this study, the corrosion current density measurement was only conducted from the cathodic branch of polarization curves to avoid the experimental errors caused by anodic polarization. Taking into consideration of the diffusion process, the cathodic current density Ic can be expressed by following equation [38, 47]:
| (4) |
where Icorr is the corrosion current density, IL is the diffusion limiting current density, ΔE is the overpotential and βc is the cathodic Tafel slope. According to Eq. (4), the cathodic current density Ic was determined by the diffusion limiting current density.
For a one-dimensional diffusion system, the theoretical diffusion limiting current density can be calculated according to the Nernst–Fick equation [39]:
| (5) |
where n is the number of the electrons involved in the hydrogen reduction reaction, F is the Faraday constant, DH+ is the diffusion coefficient, [H+] is the concentration of H+ in the TEL and the δ is the thickness of the diffusion layer. It can be seen from Eq. (5) that IL is dependent on the value of both [H+] and δ, since the other factors are constants in same system. Generally, δ is in the range of 10∼100 μm [47]. Therefore, the influential factor to IL should be discussed in two situations of TEL model:
(1) When the TEL thickness d > 200 μm (d > 2δ), the diffusion layer of both corroded metal electrode and PTFE film are intact, the TEL model can be regarded as a one-dimensional diffusion system and the Nernst–Fick equation is suitable for this situation. Therefore, IL is mainly dominated by [H+]. Considering surface alkalization resulted from dissolution of magnesium, the cathodic reaction produces hydroxyl and thus the local pH increases at cathodic sites [39]. So an increase in [H+] results in a lower IL. That is, a higher Ic for the same material according to Eq. (4), which fit for cathodic polarization curves in Region II.
(2) When the thickness of TEL d < 200 μm (d < 2δ), the opposite effects of [H+] and δ will result in a swing in the cathodic polarization for pure Mg. However, the micro-galvanic corrosion between the α-matrix and the β phase should be taken into consideration for the AZ91 alloy and it could not be regarded as a simple one-dimensional diffusion system. The Icorr is mainly dominated by the uneven distribution of current, which explains the reason that the AZ91 alloy is more sensitive to the TEL thickness in Region I.
Figure 6a and b shows the three-dimension (3D) images of the microstructures of pure Mg and the AZ91 alloy, respectively. The microstructure for pure Mg was characterized by α-Mg phase, while for the AZ91 alloy both Mg17Al12 (β) phase and the α-Mg phase. The Mg17Al12 distributed at grain boundaries (GBs) were evidently distinguished by the height difference between theα-Mg matrix and the β phase (Fig. 6b). When exposed to the electrolyte, the Mg17Al12 phase with a relatively high potential thus acted as the cathode with respect to the adjacent α-Mg phase as the anode. It is clear from Fig. 6b that a relatively rougher surface was formed on the AZ91 alloy due to the potential difference between the α-Mg and the β phases after etching. Figure 6c and d discloses the corrosion morphology of the pure Mg sample and the AZ91 alloy after TEL tests (with a thickness of 50 μm), respectively. Corrosion pits were randomly distributed on the surface of the pure Mg samples due to the presence of impurities enriched in GBs, the potential of which is higher than that of the α-Mg phase. Interestingly, it is found that the height between the α–Mg and β phases increased from 3.54 μm to 5.20 μm for the AZ91 alloy before and after the TEL tests due to the dissolution of the α–Mg matrix. The Mg(OH)2 corrosion products of the AZ91 alloy precipitated on the boundary of Mg17Al12 phase due to the dissolution of the α-Mg matrix surrounding the β phases. Furthermore, Fig. 6e and f illustrates the corrosion morphology of the pure Mg sample and the AZ91 alloy after TEL tests with a thickness of 500 μm. The corrosion product was uniformly covered on the pure Mg sample and the number of the corrosion pits was much less in Fig. 6e than that in Fig. 6c, implying for the pure Mg sample uniform corrosion occurred more preferentially under thicker TEL (500 μm) than thinner TEL (50 μm). The stacking of the corrosion product reduces the height between the α-Mg and β phases of AZ91 alloy in Fig. 6f from 5.2 μm at a thickness of 500 μm to 3.04 μm at a thickness of 50 μm. These phenomena describe that the corrosion behavior of both pure Mg and AZ91 alloy tends to be localization under TEL condition especially when the thickness of TEL is lower than a certain value. Namely, localized corrosion is easier to occur under TEL condition than in the bulk solution.
Conclusions
A TEL cell has been built to mimic the in vivo microenvironment and utilized to evaluate the in vitro corrosion rate of biomedical magnesium alloys. It is concluded as following:
The TEL can inhibit the in vivo corrosion of pure Mg and the AZ91 alloy. When the thickness of TEL less than 200 μm, the AZ91 alloy is more sensitive than pure Mg to the inhibition of corrosion; however, there is no significant change in corrosion current density for pure Mg.
The TEL thickness affects the distribution of current. Under the TEL condition (i.e. 50 μm thick), corrosion resistance for the pure Mg and the AZ91 alloy is predominately controlled by the uneven distribution of current. On the contrary, in the bulk solution (i.e. 500 μm thick), corrosion resistance for the pure Mg and the AZ91 alloy is predominately controlled by the uniform distribution of current.
The 3D images demonstrate that localized corrosion is more preferential to occur under the TEL condition than in the bulk solution.
The in vivo corrosion performed on the TEL cell may reflect the slight influence of tissue microenvironment. The TEL device might be a universal in vitro method for biodegradable Mg implants. However, it should be noted that the in vivo circumstance was a complex system including inorganic ions, corrosion medium volume, pH, blood flow, proteins and tissues. The TEL was a still a micro-scale model, which needs to consider with other factors on comprehensive degradation.
Acknowledgements
This work was supported by National Natural Science Foundation of China (51571134), SDUST Research Fund (2014TDJH104), Joint Innovative Center for Safe and Effective Mining Technology and Equipment of Coal Resources and Shandong Province.
Conflict of interest statement. The authors declare that they have no competing financial interests.
References
- [1].Zheng Y, Gu X, Witte F. Biodegradable metals. Mat Sci Eng R Rep 2014;77:1–34. [Google Scholar]
- [2].Zeng R, Dietzel W, Witte F. et al. Progress and challenge for magnesium alloys as biomaterials. Adv Eng Mat 2008;10:B3–14. [Google Scholar]
- [3].Zeng R-C, Hu Y, Guan S-K. et al. Corrosion of magnesium alloy AZ31: the influence of bicarbonate, sulphate, hydrogen phosphate and dihydrogen phosphate ions in saline solution. Corros Sci 2014;86:171–82. [Google Scholar]
- [4].Zeng R-C, Wang L, Zhang D-F. et al. In vitro corrosion of Mg-6Zn-1Mn-4Sn-1.5 Nd/0.5 Y alloys. Front Mater Sci 2014;8:230–43. [Google Scholar]
- [5].Xu L, Yu G, Zhang E. et al. In vivo corrosion behavior of Mg‐Mn‐Zn alloy for bone implant application. J Biomed Mater Res 2007;83:703–11. [DOI] [PubMed] [Google Scholar]
- [6].Hort N, Huang Y, Fechner D. et al. Magnesium alloys as implant materials—principles of property design for Mg–RE alloys. Acta Biomater 2010;6:1714–25. [DOI] [PubMed] [Google Scholar]
- [7].Zeng R-C, Qi W-C, Cui H-Z. et al. In vitro corrosion of as-extruded Mg–Ca alloys—the influence of Ca concentration. Corros Sci 2015;96:23–31. [Google Scholar]
- [8].Zeng R-C, Sun L, Zheng Y-F. et al. Corrosion and characterisation of dual phase Mg–Li–Ca alloy in Hank’s solution: the influence of microstructural features. Corros Sci 2014;79:69–82. [Google Scholar]
- [9].Mao L, Shen L, Niu J. et al. Nanophasic biodegradation enhances the durability and biocompatibility of magnesium alloys for the next-generation vascular stents. Nanoscale 2013;5:9517–22. [DOI] [PubMed] [Google Scholar]
- [10].Henderson SE, Verdelis K, Maiti S. et al. Magnesium alloys as a biomaterial for degradable craniofacial screws. Acta Biomater 2014;10:2323–32. [DOI] [PMC free article] [PubMed] [Google Scholar]
- [11].Bowen PK, Drelich A, Drelich J. et al. Rates of in vivo (arterial) and in vitro biocorrosion for pure magnesium. J Biomed Mater Res 2014;103:341–9. [DOI] [PubMed] [Google Scholar]
- [12].Witte F, Fischer J, Nellesen J. et al. In vitro and in vivo corrosion measurements of magnesium alloys. Biomaterials 2006;27:1013–8. [DOI] [PubMed] [Google Scholar]
- [13].Yang J, Cui F, Lee IS. Surface modifications of magnesium alloys for biomedical applications. Ann Biomed Eng 2011;39:1857–71. [DOI] [PubMed] [Google Scholar]
- [14].Bowen PK, Drelich J, Goldman J. A new in vitro–in vivo correlation for bioabsorbable magnesium stents from mechanical behavior. Mater Sci Eng 2013;33:5064–70. [DOI] [PubMed] [Google Scholar]
- [15].Kirkland NT, Birbilis N, Staiger MP. Assessing the corrosion of biodegradable magnesium implants: a critical review of current methodologies and their limitations. Acta Biomater 2012;8:925–36. [DOI] [PubMed] [Google Scholar]
- [16].Shi Z, Liu M, Atrens A. Measurement of the corrosion rate of magnesium alloys using Tafel extrapolation. Corros Sci 2010;52:579–88. [Google Scholar]
- [17].Xin YC, Hu T, Chu PK. Influence of test solutions on in vitro studies of biomedical magnesium alloys. J Electrochem Soc 2010;157:C238–43. [Google Scholar]
- [18].Liu C, Wang Y, Zeng R. et al. In vitro corrosion degradation behaviour of Mg–Ca alloy in the presence of albumin. Corros Sci 2010;52:3341–7. [Google Scholar]
- [19].Gu XN, Zheng YF, Chen LJ. Influence of artificial biological fluid composition on the biocorrosion of potential orthopedic Mg-Ca, AZ31, AZ91 alloys. Biomed Mater 2009;4:065011. [DOI] [PubMed] [Google Scholar]
- [20].Zeng R-C, Li X-T, Li S-Q. et al. In vitro degradation of pure Mg in response to glucose. Sci Rep 2015;5:13026. [DOI] [PMC free article] [PubMed] [Google Scholar]
- [21].Zeng R, Chen J, Ke W. et al. PH value in simulated occluded cell for magnesium alloys. Trans Nonferrous Met Soc China 2007;17:s193–s9. [Google Scholar]
- [22].Liu X, Xi T, Zheng Y. Influence of the extraction parameters on the cytotoxicity test results of Mg materials. Prog Nat Sci Mater Int 2014;24:507–15. [Google Scholar]
- [23].Mai ED, Liu H. Investigation on magnesium degradation under flow versus static conditions using a novel impedance-driven flow apparatus. Prog Nat Sci Mater Int 2014;24:554–60. [Google Scholar]
- [24].Harrison R, Maradze D, Lyons S. et al. Corrosion of magnesium and magnesium–calcium alloy in biologically-simulated environment. Prog Nat Sci Mater Int 2014;24:539–46. [Google Scholar]
- [25].Nguyen TY, Liew CG, Liu H. An in vitro mechanism study on the proliferation and pluripotency of human embryonic stems cells in response to magnesium degradation. PLoS One 2013;8:377–80. [DOI] [PMC free article] [PubMed] [Google Scholar]
- [26].Hou L, Li Z, Pan Y. et al. In vitro and in vivo studies on biodegradable magnesium alloy. Prog Nat Sci Mater Int 2014;24:466–71. [Google Scholar]
- [27].Zeng R, Zhou W, Han E. et al. Effect of pH values on as-extruded magnesium alloy AM60. Acta Metall Sinica 2009;3:307–11. [Google Scholar]
- [28].Dezfuli SN, Huan Z, Mol JMC. et al. Influence of HEPES buffer on the local pH and formation of surface layer during in vitro degradation tests of magnesium in DMEM. Prog Nat Sci Mater Int 2014;531–8. [Google Scholar]
- [29].Kannan MB, Yamamoto A, Khakbaz H. Influence of living cells (L929) on the biodegradation of magnesium-calcium alloy. Colloids Surf B Biointerfaces 2015;126:603–6. [DOI] [PubMed] [Google Scholar]
- [30].Yamamoto A, Hiromoto S. Effect of inorganic salts, amino acids and proteins on the degradation of pure magnesium in vitro. Mater Sci Eng C 2009;29:1559–68. [Google Scholar]
- [31].Walker J, Shadanbaz S, Kirkland NT. et al. Magnesium alloys: predicting in vivo corrosion with in vitro immersion testing. J Biomed Mater Res B Appl Biomater 2012;100:1134–41. [DOI] [PubMed] [Google Scholar]
- [32].Zainal Abidin NI, Rolfe B, Owen H. et al. The in vivo and in vitro corrosion of high-purity magnesium and magnesium alloys WZ21 and AZ91. Corros Sci 2013;75:354–66. [Google Scholar]
- [33].Robinson DA, Griffith RW, Shechtman D. et al. In vitro antibacterial properties of magnesium metal against Escherichia coli, Pseudomonas aeruginosa and Staphylococcus aureus. Acta Biomater 2010;6:1869–77. [DOI] [PubMed] [Google Scholar]
- [34].Enderle JD, Bronzino JD. Introduction to Biomedical Engineering. Academic Press, UT, 2012. [Google Scholar]
- [35].Remita E, Sutter E, Tribollet B. et al. A thin layer cell adapted for corrosion studies in confined aqueous environments. Electrochim Acta 2007;52:7715–23. [Google Scholar]
- [36].Mueller W-D, Lucia Nascimento M, Lorenzo de Mele MF. Critical discussion of the results from different corrosion studies of Mg and Mg alloys for biomaterial applications. Acta Biomater 2010;6:1749–55. [DOI] [PubMed] [Google Scholar]
- [37].Boughrara D, Hamadou L, Kadri A. et al. Thin electrolyte layer thickness effect on corrosion behaviour of invar in sulphate solutions. Corros Eng Sci Technol 2007;42:207–14. [Google Scholar]
- [38].Cheng YL, Zhang Z, Cao FH. et al. A study of the corrosion of aluminum alloy 2024-T3 under thin electrolyte layers. Corros Sci 2004;46:1649–67. [Google Scholar]
- [39].Liu W, Cao F, Chen A. et al. Corrosion behaviour of AM60 magnesium alloys containing Ce or La under thin electrolyte layers. Part 1: microstructural characterization and electrochemical behaviour. Corros Sci 2010;52:627–38. [Google Scholar]
- [40].Liu W, Cao F, Jia B. et al. Corrosion behaviour of AM60 magnesium alloys containing Ce or La under thin electrolyte layers. Part 2: corrosion product and characterization. Corros Sci 2010;52:639–50. [Google Scholar]
- [41].Zhang T, Chen C, Shao Y. et al. Corrosion of pure magnesium under thin electrolyte layers. Electrochim Acta 2008;53:7921–31. [Google Scholar]
- [42].Venkatraman MS, Cole IS, Emmanuel B. Model for corrosion of metals covered with thin electrolyte layers: pseudo-steady state diffusion of oxygen. Electrochim Acta 2011;56:7171–9. [Google Scholar]
- [43].Chen C, Zhang T, Meng G. et al. Corrosion behavior. Of Mg-10Gd-2Y-0.4Zr alloy under thin electrolyte layers. Mater Corros 2009;61:388–97. [Google Scholar]
- [44].Walker J, Shadanbaz S, Woodfield TB. et al. The in vitro and in vivo evaluation of the biocompatibility of Mg alloys. Biomed Mater 2014;9:015006. [DOI] [PubMed] [Google Scholar]
- [45].Liao X, Cao F, Zheng L. et al. Corrosion behaviour of copper under chloride-containing thin electrolyte layer. Corros Sci 2011;53:3289–98. [Google Scholar]
- [46].Cruz R, Nishikata A, Tsuru T. AC impedance monitoring of pitting corrosion of stainless steel under a wet-dry cyclic condition in chloride-containing environment. Corros Sci 1996;38:1397–406. [Google Scholar]
- [47].Cao C. Principles of Electrochemistry of Corrosion. Beijing: Chemical Industry Press, 2008. [Google Scholar]


